Consul discovers Google Cloud Run
- 5 minutes read - 920 wordsI’ve written a basic discoverer of Google Cloud Run services. This is for a project and it extends work done in some previous posts to Multiplex gRPC and Prometheus with Cloud Run and to use Consul for Prometheus service discovery.
This solution:
- Accepts a set of Google Cloud Platform (GCP) projects
- Trawls them for Cloud Run services
- Assumes that the services expose Prometheus metrics on
:443/metrics - Relabels the services
- Surfaces any discovered Cloud Run services’ metrics in Prometheus
You’ll need Docker and Docker Compose.
You’ll want to clone the Consul Service Discovery for Cloud Run repo and then cd to the consul-sd-cloudrun directory:
Edit the docker-compose.yml file and:
- Replace
/home/useridwith your userid (the value ofwhoami - Set
--project_idsto some set of your GCP project IDs
NOTE This must be the project ID value not the project number
Alternatively, if you’re using bash, you can:
sed \
--in-place "s|/home/userid|/home/$(whoami)|g" \
./docker-compose.yml

PROJECTS=$(\
  gcloud projects list \
  --format='csv[no-heading,terminator=","](projectId)') && \
PROJECTS="${PROJECTS%,}" && \
echo ${PROJECTS}

sed \
--in-place "s|--project_ids=...|--project_ids=${PROJECTS}|g" \
./docker-compose.yml
Then:
docker-compose up
This should start 4 services:
docker-compose ps

docker-compose ps
   Name      State                   Ports
---------------------------------------------------
cadvisor     Up (health: starting)   8089->8080/tcp
consul       Up                      8500->8500/tcp
discoverer   Up                      9402/tcp
prometheus   Up                      9090->9090/tcp
You can browse:
| Description | Endpoint |
|---|---|
| Prometheus | http://localhost:9090 |
| Prometheus: Service Discovery | http://localhost:9090/service-discovery |
| Prometheus: Targets | http://localhost:9090/targets |
| Consul | http://localhost:8500 |
Here’s the mostly (!) empty Consul services screen. Consul is preconfigured with a service called consul that points to itself (and serves metrics):

And Prometheus’ Service Discovery and Targets:

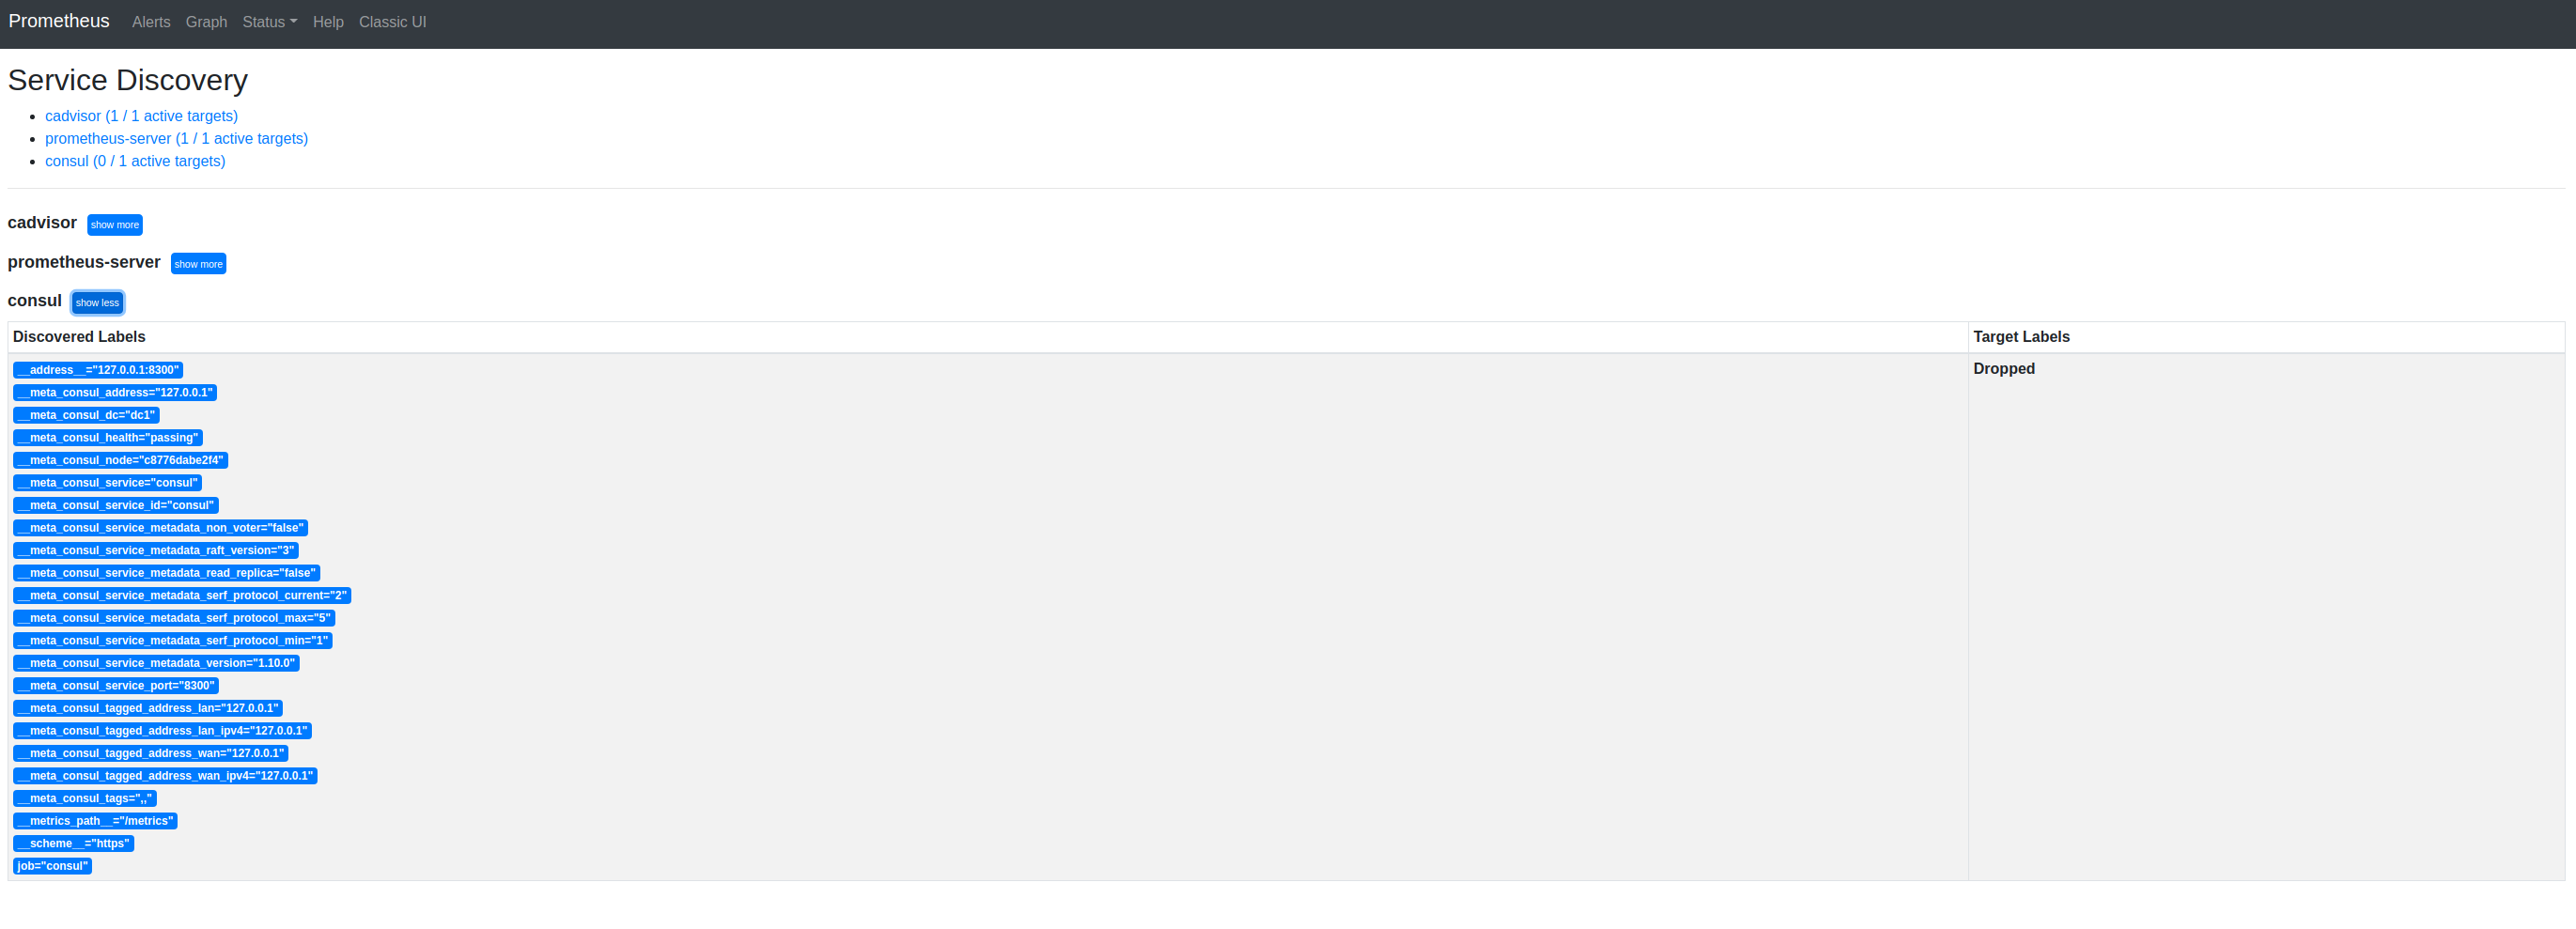
You’ll see that consul includes a discovered service that has Target Labels as Dropped. This is the Consul default service called consul. We’re not interested in scraping it and so Prometheus is configured (see below) to drop it.

You’ll want to deploy somethings to Cloud Run that publishes Prometheus metrics. I recommend a couple of copies of Node Exporter as I did in my previous post. You’ll need to copy Node Exporter to your project’s Container Registry first:
docker pull \
  prom/node-exporter:v1.1.2
docker tag \
  prom/node-exporter:v1.1.2 \
  us.gcr.io/${PROJECT}/node-exporter:v1.1.2
docker push \
  us.gcr.io/${PROJECT}/node-exporter:v1.1.2
And then you can deploy an arbitrary number of Cloud Run services:
for PAIR in "foo,us-west1" "bar,us-east4"
do
  IFS=, read NAME REGION <<< ${PAIR}
  gcloud run deploy ${NAME} \
  --max-instances=1 \
  --image=us.gcr.io/${PROJECT}/node-exporter:v1.1.2 \
  --ingress=all \
  --platform=managed \
  --port=9100 \
  --allow-unauthenticated \
  --region=${REGION} \
  --project=${PROJECT}
done
Which should provide 2 services:
gcloud run services list \
--platform=managed \
--project=${PROJECT} \
--format="value(status.url)"

https://foo-ecvsk5f7yq-uw.a.run.app
https://bar-ecvsk5f7yq-uk.a.run.app
And:

And, after a few seconds, the service’s logs show that these have been discovered:
docker-compose logs discoverer
Attaching to discoverer
discoverer    | 2021/05/21 00:33:03  "caller"={"file":"main.go","line":46} "level"=0 "msg"="Projects"  "projectIDs"="[[PROJECT]]"
discoverer    | 2021/05/21 00:33:03  "caller"={"file":"main.go","line":47} "level"=0 "msg"="Frequency"  "frequency"=15000000000
discoverer    | 2021/05/21 00:33:03  "caller"={"file":"main.go","line":72} "level"=0 "msg"="Enumerating Projects"  "start"="2021-05-21T00:33:03.911219642Z"
discoverer    | 2021/05/21 00:33:04 List "caller"={"file":"client.go","line":81} "level"=0 "msg"="Done" "projectID"="[[PROJECT]]"
discoverer    | 2021/05/21 00:33:04  "caller"={"file":"main.go","line":91} "level"=0 "msg"="Wants"  "key"="4d0e7b0f381dd5558ec58ee1e2da7fc5c23cd5f0fdb5cb527c017024"
discoverer    | 2021/05/21 00:33:04 Create "caller"={"file":"client.go","line":69} "level"=0 "msg"="Service registered" "serviceID"="4d0e7b0f381dd5558ec58ee1e2da7fc5c23cd5f0fdb5cb527c017024" "serviceName"="bar"
discoverer    | 2021/05/21 00:33:04  "caller"={"file":"main.go","line":91} "level"=0 "msg"="Wants" "ID"="4d0e7b0f381dd5558ec58ee1e2da7fc5c23cd5f0fdb5cb527c017024" "key"="adc3f9454716c574d133aa69def9be1668f84c2a9a415b5eb0f6a520"
discoverer    | 2021/05/21 00:33:04 Create "caller"={"file":"client.go","line":69} "level"=0 "msg"="Service registered" "serviceID"="adc3f9454716c574d133aa69def9be1668f84c2a9a415b5eb0f6a520" "serviceName"="foo"
discoverer    | 2021/05/21 00:33:04  "caller"={"file":"main.go","line":127} "level"=0 "msg"="Sleeping" "ID"="adc3f9454716c574d133aa69def9be1668f84c2a9a415b5eb0f6a520" "ID"="adc3f9454716c574d133aa69def9be1668f84c2a9a415b5eb0f6a520" "remaining"=14413173792
And, the Consul UI shows that they’ve been added:

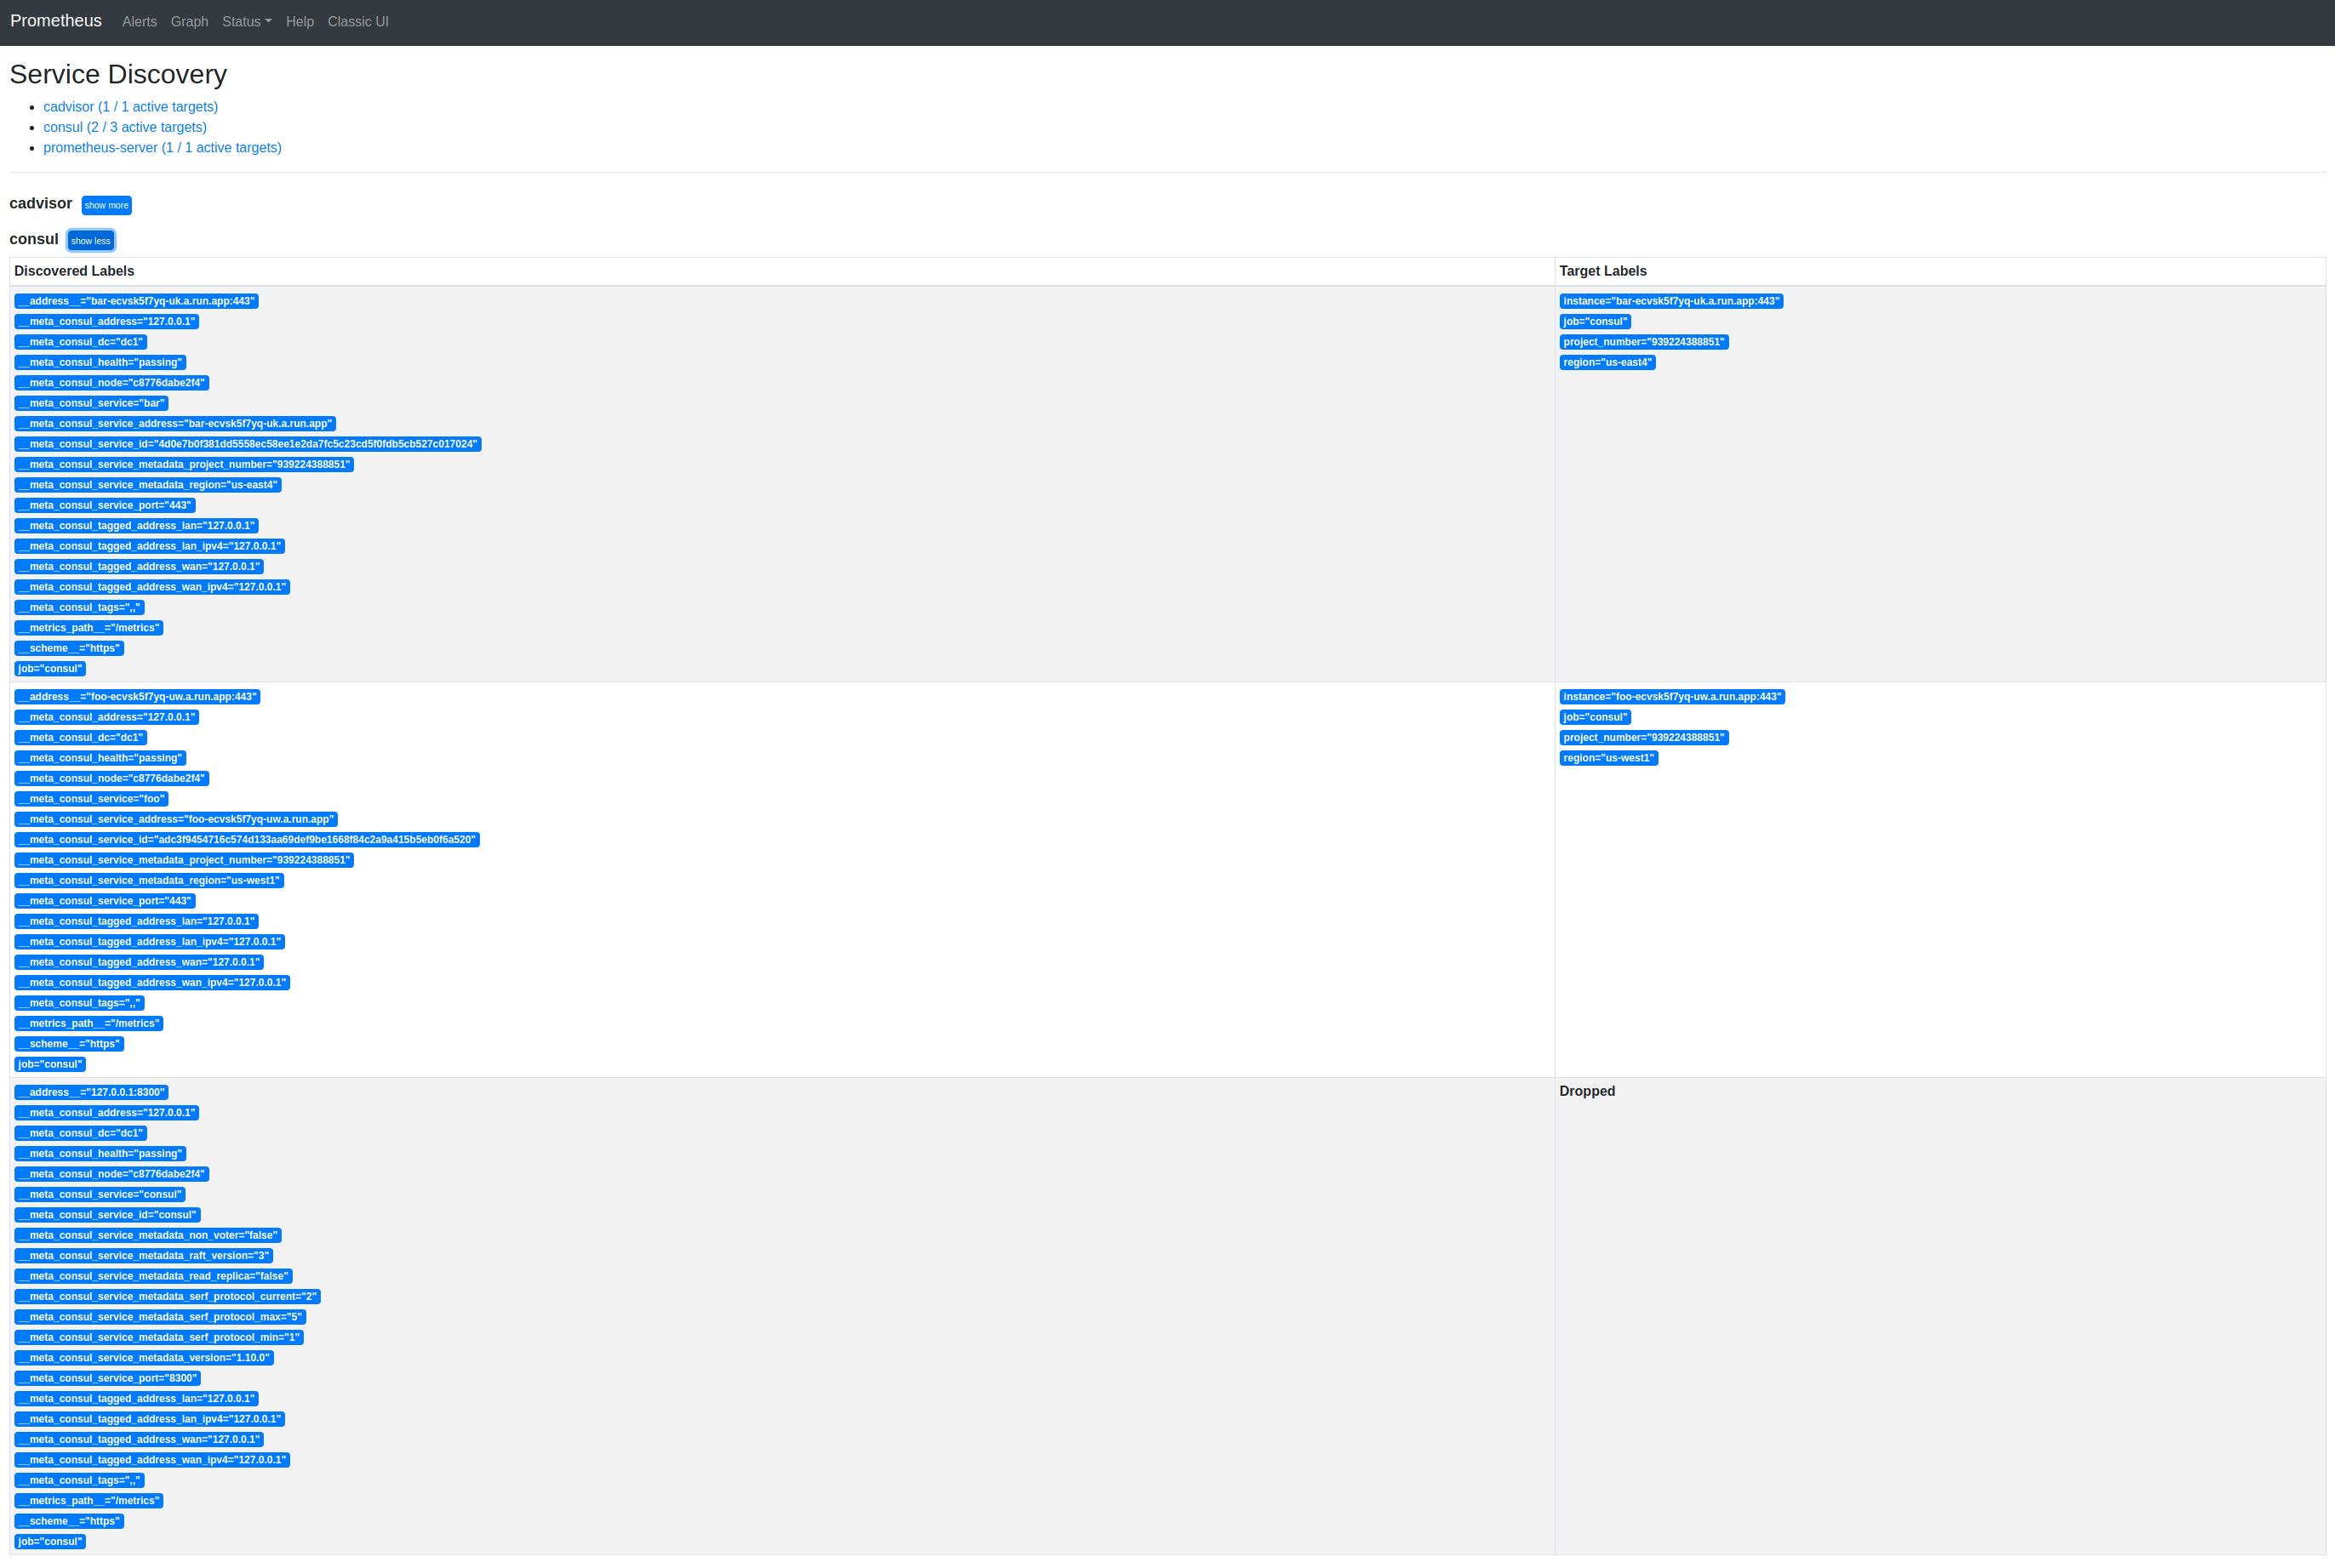
And, the Prometheus Service Discovery includes them:

And, the Prometheus Targets includes them:

NOTE Customarily, Prometheus’ targets are shown but inaccessible because, while they’re accessible as shown to Prometheus, they’re inaccessible to the viewer. But, in this case, we’re being presented with public Cloud Run endpoints. As long as you have access to the Cloud Run service, you can click the links shown here to browse the metrics.
You’ll notice that the Service Discovery “Target Labels” include not only the default instance=${CLOUD_RUN_ENDPOINT} and job=consul labels but also – hopefully – project_number and region.
As you can infer, these correspond to the values from the Cloud Run service, but how?
Prometheus relabelling incantations is how.
prometheus.yml:
scrape_configs:
  - job_name: consul
    scheme: https
    consul_sd_configs:
      - server: consul:8500
        datacenter: dc1
        # tags:
        #   - foo
    relabel_configs:
      - action: drop
        source_labels:
          - __meta_consul_service_port
        regex: "8300"
      - action: labelmap
        regex: __meta_consul_service_metadata_(.+)
The are two configs here:
dropwas mentioned previously and is used to discard theconsulservice from the results. While useful, this service publishes metrics on:8300/v1/agent/metrics. It doesn’t corerspond to a Cloud Run service and so it’s being dropped from these results.labelmaphas the effect (see How to use relabelling in Prometheus and VictoriaMetrics for good examples) taking e.g.__meta_consul_service_metadata_project_number="..."and converting it toproject_number="..."which is less cumbersome.
And, for want of something interesting to graph, here’s the delta between scrape times for a Cloud Run serivce deployed in us-west1 (The Dalles, OR) and us-east4 (Ashburn, VA)
Don’t forge to delete the Cloud Run services when you’re done with them:
for PAIR in "foo,us-west1" "bar,us-east4"
do
  IFS=, read NAME REGION <<< ${PAIR}
  gcloud run services delete ${NAME} \
  --platform=managed \
  --region=${REGION} \
  --project=${PROJECT} \
  --quiet
done
Notes
If you want to delete a service from Consul, you can PUT a request on the agent’s deregister endpoint:
curl \
--request PUT \
localhost:8500/v1/agent/service/deregister/${ID}
But you’ll need to ID of the service you want to delete. You can grab this from the Consul UI or you can calculate it:
NAME="foo"
REGION="us-west1"

# Retrieve the Cloud Run service's URL
ENDPOINT=$(\
  gcloud run services describe ${NAME} \
  --project=${PROJECT} \
  --platform=managed \
  --region=${REGION} \
  --format="value(status.address.url)") && \

# Remove the prefixing https://
ENDPOINT="${ENDPOINT#https://}"

# Remove the suffixing / (if any)
ENDPOINT="${ENDPOINT%/}"

# Add the port
ENDPOINT="${ENDPOINT}:443"

# Calculate SHA224 hash of the result
ID=$(printf ${ENDPOINT} | sha224sum | head --bytes=56)

# Delete the service from Consul
curl \
--request PUT \
localhost:8500/v1/agent/service/deregister/${ID}