Below you will find pages that utilize the taxonomy term “Prometheus”
Posts
read more
Prometheus Exporter documentation
I have a new router that runs OpenWRT and it provides a Prometheus (Node) Exporter (written in Lua)
NOTE The
prometheus-node-exporter-luaExporter package is a 4KB (!) script
As I’m sure is a common experience for others, it’s great that there’s an Exporter and a wealth of metrics exposed by it. One problem is that there’s no guidance on how to use these metrics to construct useful PromQL queries and Alertmanager alerts.
I think it would be useful for Exporters to publish a Documentation endpoints (perhaps /docs to go along with /metrics) that would include such guidance.
Posts
read more
Prometheus MCP Server
I was unable to find a Model Context Protocol (MCP) server implementation for Prometheus. I had a quiet weekend and so I’ve been writing one: prometheus-mcp-server.
I used the code from the MCP for gRPC Health Checking protocol that I wrote about previously as a guide.
I wrote a series of stdin and HTTP tests to have confidence that the service is working correctly but I had no MCP host.
I discovered that Visual Studio Code through its GitHub Copilot extension functions has a preview to use MCP servers i.e. function as an MCP host and access MCP servers.
Posts
read more
Migrating Prometheus Exporters to Kubernetes
I have built Prometheus Exporters for multiple cloud platforms to track resources deployed across clouds:
- Prometheus Exporter for Azure
- Prometheus Exporter for crt.sh
- Prometheus Exporter for Fly.io
- Prometheus Exporter for GoatCounter
- Prometheus Exporter for Google Analytics
- Prometheus Exporter for Google Cloud
- Prometheus Exporter for Koyeb
- Prometheus Exporter for Linode
- Prometheus Exporter for PorkBun
- Prometheus Exporter for updown.io
- Prometheus Exporter for Vultr
Additionally, I’ve written two status service exporters:
These exporters are all derived from an exemplar DigitalOcean Exporter written by metalmatze for which I maintain a fork.
Posts
read more
Prometheus Exporter for USGS Water Data service
I’m a little obsessed with creating Prometheus Exporters:
- Prometheus Exporter for Azure
- Prometheus Exporter for crt.sh
- Prometheus Exporter for Fly.io
- Prometheus Exporter for GoatCounter
- Prometheus Exporter for Google Cloud
- Prometheus Exporter for Koyeb
- Prometheus Exporter for Linode
- Prometheus Exporter for PorkBun
- Prometheus Exporter for updown.io
- Prometheus Exporter for Vultr
All of these were written to scratch an itch.
In the case of the cloud platform exporters (Azure, Fly, Google, Linode, Vultr etc.), it’s an overriding anxiety that I’ll leave resources deployed on these platforms and, running an exporter that ships alerts to Pushover and Gmail, provides me a support mechanism for me.
Posts
read more
Prometheus Protobufs and Native Histograms
I responded to a question Prometheus metric protocol buffer in gRPC on Stackoverflow and it piqued my curiosity and got me yak shaving.
Prometheus used to support two exposition formats including Protocol Buffers, then dropped Protocol Buffer and has since re-added it (see Protobuf format). The Protobuf format has returned to support the experimental Native Histograms feature.
I’m interested in adding Native Histogram support to Ackal so thought I’d learn more about this metric.
Posts
read more
Capturing e.g. CronJob metrics with GMP
The deployment of Kube State Metrics for Google Managed Prometheus creates both a PodMonitoring and ClusterPodMonitoring.
The PodMonitoring resource exposes metrics published on metric-self port (8081).
The ClusterPodMonitoring exposes metrics published on metric port (8080) but this doesn’t include cronjob-related metrics:
kubectl get clusterpodmonitoring/kube-state-metrics \
--output=jsonpath="{.spec.endpoints[0].metricRelabeling}" \
| jq -r .
[
  {
    "action": "keep",
    "regex": "kube_(daemonset|deployment|replicaset|pod|namespace|node|statefulset|persistentvolume|horizontalpodautoscaler|job_created)(_.+)?",
    "sourceLabels": [
      "__name__"
    ]
  }
]
NOTE The
regexdoes not includekube_cronjoband only includeskube_job_createdpatterns.
Posts
read more
Prometheus Operator support an auth proxy for Service Discovery
CRD linting
Returning to yesterday’s failing tests, it’s unclear how to introspect the E2E tests.
kubectl get namespaces
NAME                      STATUS   AGE
...
allns-s2os2u-0-90f56669   Active   22h
allns-s2qhuw-0-6b33d5eb   Active   4m23s
kubectl get all \
--namespace=allns-s2os2u-0-90f56669
No resources found in allns-s2os2u-0-90f56669 namespace.
kubectl get all \
--namespace=allns-s2qhuw-0-6b33d5eb
NAME                                                        READY   STATUS             RESTARTS   AGE
pod/prometheus-operator-6c96477b9c-q6qm2                    1/1     Running            0          4m12s
pod/prometheus-operator-admission-webhook-68bc9f885-nq6r8   0/1     ImagePullBackOff   0          4m7s

NAME                          TYPE        CLUSTER-IP       EXTERNAL-IP   PORT(S)   AGE
service/prometheus-operator   ClusterIP   10.152.183.247   <none>        443/TCP   4m9s

NAME                                                    READY   UP-TO-DATE   AVAILABLE   AGE
deployment.apps/prometheus-operator                     1/1     1            1           4m12s
deployment.apps/prometheus-operator-admission-webhook   0/1     1            0           4m7s

NAME                                                              DESIRED   CURRENT   READY   AGE
replicaset.apps/prometheus-operator-6c96477b9c                    1         1         1       4m13s
replicaset.apps/prometheus-operator-admission-webhook-68bc9f885   1         1         0       4m8s
kubectl logs deployment/prometheus-operator-admission-webhook \
--namespace=allns-s2qhuw-0-6b33d5eb
Error from server (BadRequest): container "prometheus-operator-admission-webhook" in pod "prometheus-operator-admission-webhook-68bc9f885-nq6r8" is waiting to start: trying and failing to pull image
NAME="prometheus-operator-admission-webhook"
FILTER="{.spec.template.spec.containers[?(@.name==\"${NAME}\")].image}"

kubectl get deployment/prometheus-operator-admission-webhook \
--namespace=allns-s2qjz2-0-fad82c03 \
--output=jsonpath="${FILTER}"
quay.io/prometheus-operator/admission-webhook:52d1e55af
Want:
Posts
read more
Prometheus Operator support an auth proxy for Service Discovery
For ackalctld to be deployable to Kubernetes with Prometheus Operator, it is necessary to Enable ScrapeConfig to use (discovery|target) proxies #5966. While I’m familiar with Kubernetes, Kubernetes operators (Ackal uses one built with the Operator SDK) and Prometheus Operator, I’m unfamiliar with developing Prometheus Operator. This (and subsequent) posts will document some preliminary work on this.
Cloned Prometheus Operator
Branched scrape-config-url-proxy
I’m unsure how to effect these changes and unsure whether documentation exists.
Clearly, I will need to revise the ScrapeConfig CRD to add the proxy_url fields (one proxy_url defines a proxy for the Service Discovery endpoint; the second defines a proxy for the targets themselves) and it would be useful for this to closely mirror the existing Prometheus HTTP Service Discovery use, namely ,http_sd_config>:
Posts
read more
Prometheus Operator `ScrapeConfig`
TL;DR Enable ScrapeConfig to use (discovery|target) proxies
I’ve developed a companion, local daemon (called ackalctld) for Ackal that provides a functionally close version of the service.
One way to deploy ackalctld is to use Kubernetes and it would be convenient if the Prometheus metrics were scrapeable by Prometheus Operator.
In order for this to work, Prometheus Operator needs to be able to scrape Google Cloud Run targets because ackalctld creates Cloud Run services for its health check clients.
Posts
read more
Prometheus Exporter for Koyeb
Yet another cloud platform exporter for resource|cost management. This time for Koyeb with Koyeb Exporter.
Deploying resources to cloud platforms generally incurs cost based on the number of resources deployed, the time each resource is deployed and the cost (per period of time) that the resource is deployed. It is useful to be able to automatically measure and alert on all the resources deployed on all the platforms that you’re using and this is an intent of these exporters.
Posts
read more
Robusta KRR w/ GMP
I’ve been spending time recently optimizing Ackal’s use of Google Cloud Logging and Cloud Monitoring in posts:
- Filtering metrics w/ Google Managed Prometheus
- Kubernetes metrics, metrics everywhere
- Google Metric Diagnostics and Metric Data Ingested
Yesterday, I read that Robusta has a new open source project Kubernetes Resource Recommendations (KRR) so I took some time to evaluate it.
This post describes the changes I had to make to get KRR working with Google Managed Prometheus (GMP):
Posts
read more
Google Metric Diagnostics and Metric Data Ingested
I’ve been on an efficiency drive with Cloud Logging and Cloud Monitoring.
With regards Cloud Logging, I’m contemplating (!) eliminating almost all log storage. As it is I’ve buzz cut log storage with a _Default sink that has comprehensive sets of NOT LOG_ID(X) inclusion and exclusion filters. As I was doing so, I began to wonder why I need to pay for the storage of much logging. There’s the comfort from knowing that everything you may ever need is being logged (at least for 30 days) but there’s also the costs that that entails. I use logs exclusively for debugging which got me thinking, couldn’t I just capture logs when I’m debugging (rather thna all the time?). I’ve not taken that leap yet but I’m noodling on it.
Posts
read more
Prometheus Exporter for Azure (Container Apps)
I’ve written Prometheus Exporters for various cloud platforms. My motivation for writing these Exporters is that I want a unified mechanism to track my usage of these platform’s services. It’s easy to deploy a service on a platform and inadvertently leave it running (up a bill). The set of exporters is:
- Prometheus Exporter for Azure
- Prometheus Exporter for Fly.io
- Prometheus Exporter for GCP
- Prometheus Exporter for Linode
- Prometheus Exporter for Vultr
This post describes the recently-added Azure Exporter which only provides metrics for Container Apps and Resource Groups.
Posts
read more
Kubernetes metrics, metrics everywhere
I’ve been tinkering with ways to “unit-test” my assumptions when using cloud platforms. I recently wrote about good posts by Google describing achieving cost savings with Cloud Monitoring and Cloud Logging:
- How to identify and reduce costs of your Google Cloud observability in Cloud Monitoring
- Cloud Logging pricing for Cloud Admins: How to approach it & save cost
With Cloud Monitoring, I’ve restricted the prometheus.googleapis.com metrics that are being ingested but realized I wanted to track the number of Pods (and Containers) deployed to a GKE cluster.
Posts
read more
Filtering metrics w/ Google Managed Prometheus
Google has published two, very good blog posts on cost management:
- How to identify and reduce costs of your Google Cloud observability in Cloud Monitoring
- Cloud Logging pricing for Cloud Admins: How to approach it & save cost
This post is about my application cost reductions for Cloud Monitoring for Ackal.
I’m pleased with Google Cloud Managed Service for Prometheus (hereinafter GMP). I’ve a strong preference for letting service providers run components of Ackal that I consider important but non-differentiating.
Posts
read more
Kubernetes Operators
Ackal uses a Kubernetes Operator to orchestrate the lifecycle of its health checks. Ackal’s Operator is written in Go using kubebuilder.
Yesterday, my interest was piqued by a MetalBear blog post Writing a Kubernetes Operator [in Rust]. I spent some time reimplementing one of Ackal’s CRDs (Check) using kube-rs and not only refreshed my Rust knowledge but learned a bunch more about Kubernetes and Operators.
While rummaging around the Kubernetes documentation, I discovered flant’s Shell-operator and spent some time today exploring its potential.
Posts
read more
Authenticate PromLens to Google Managed Prometheus
I’m using Google Managed Service for Prometheus (GMP) and liking it.
Sometime ago, I tried using PromLens with GMP but GMP’s Prometheus HTTP API endpoint requires auth and I’ve battled Prometheus’ somewhat limited auth mechanism before (Scraping metrics exposed by Google Cloud Run services that require authentication).
Listening to PromCon EU 2022 videos, I learned that PromLens has been open sourced and contributed to the Prometheus project. Eventually, the functionality of PromLens should be combined into the Prometheus UI.
Posts
read more
Prometheus Exporters for fly.io and Vultr
I’ve been on a roll building utilities this week. I developed a Service Health dashboard for my “thing”, a Prometheus Exporter for Fly.io and today, a Prometheus Exporter for Vultr. This is motivated by the fear that I will forget a deployed Cloud resource and incur a horrible bill.
I’ve no written several Prometheus Exporters for cloud platforms:
- Prometheus Exporter for GCP
- Prometheus Exporter for Linode
- Prometheus Exporter for Fly.io
- Prometheus Exporter for Vultr
Each of them monitors resource deployments and produces resource count metrics that can be scraped by Prometheus and alerted with Alertmanager. I have Alertmanager configured to send notifications to Pushover. Last week I wrote an integration between Google Cloud Monitoring to send notifications to Pushover too.
Posts
read more
Prometheus HTTP Service Discovery of Cloud Run services
Some time ago, I wrote about using Prometheus Service Discovery w/ Consul for Cloud Run and also Scraping metrics exposed by Google Cloud Run services that require authentication. Both solutions remain viable but they didn’t address another use case for Prometheus and Cloud Run services that I have with a “thing” that I’ve been building.
In this scenario, I want to:
- Configure Prometheus to scrape Cloud Run service metrics
- Discover Cloud Run services dynamically
- Authenticate to Cloud Run using Firebase Auth ID tokens
These requirements and – one other – present several challenges:
Posts
read more
Scraping metrics exposed by Google Cloud Run services that require authentication
I’ve written a solution (gcp-oidc-token-proxy) that can be used in conjunction with Prometheus OAuth2 to authenticate requests so that Prometheus can scrape metrics exposed by e.g. Cloud Run services that require authentication. The solution resulted from my question on Stack overflow.
Problem #1: Endpoint requires authentication
Given a Cloud Run service URL for which:
ENDPOINT="my-server-blahblah-wl.a.run.app"

# Returns 200 when authentication w/ an ID token
TOKEN="$(gcloud auth print-identity-token)"
curl \
--silent \
--request GET \
--header "Authorization: Bearer ${TOKEN}" \
--write-out "%{response_code}" \
--output /dev/null \
https://${ENDPOINT}/metrics

# Returns 403 otherwise
curl \
--silent \
--request GET \
--write-out "%{response_code}" \
--output /dev/null \
https://${ENDPOINT}/metrics
Problem #2: Prometheus OAuth2 configuration is constrained
Posts
read more
Consul discovers Google Cloud Run
I’ve written a basic discoverer of Google Cloud Run services. This is for a project and it extends work done in some previous posts to Multiplex gRPC and Prometheus with Cloud Run and to use Consul for Prometheus service discovery.
This solution:
- Accepts a set of Google Cloud Platform (GCP) projects
- Trawls them for Cloud Run services
- Assumes that the services expose Prometheus metrics on
:443/metrics - Relabels the services
- Surfaces any discovered Cloud Run services’ metrics in Prometheus
You’ll need Docker and Docker Compose.
Posts
read more
Multiplexing gRPC and HTTP (Prometheus) endpoints with Cloud Run
Google Cloud Run is useful but, each service is limited to exposing a single port. This caused me problems with a gRPC service that serves (non-gRPC) Prometheus metrics because customarily, you would serve gRPC on one port and the Prometheus metrics on another.
Fortunately, cmux provides a solution by providing a mechanism that multiplexes both services (gRPC and HTTP) on a single port!
TL;DR See the cmux Limitations and use:
grpcl := m.MatchWithWriters(
   cmux.HTTP2MatchHeaderFieldSendSettings("content-type", "application/grpc"))
Extending the example from the cmux repo:
Posts
read more
Prometheus Service Discovery w/ Consul for Cloud Run
I’m working on a project that will programmatically create Google Cloud Run services and I want to be able to dynamically discover these services using Prometheus.
This is one solution.
NOTE Google Cloud Run is the service I’m using, but the principle described herein applies to any runtime service that you’d wish to use.
Why is this challenging? IIUC, it’s primarily because Prometheus has a limited set of plugins for service discovery, see the sections that include _sd_ in Prometheus Configuration documentation. Unfortunately, Cloud Run is not explicitly supported. The alternative appears to be to use file-based discovery but this seems ‘challenging’; it requires, for example, reloading Prometheus on file changes.
Posts
read more
Prometheus VPA Recommendations
Phew!
I was interested in learning how to Manage Resources for Containers. On the way, I learned and discovered:
kubectl top- Vertical Pod Autoscaler
- A (valuable) digression through PodMonitor
kube-state-metrics- `kubectl-patch
- Created a Graph
- References
Kubernetes Resources
Visual Studio Code has begun to bug me (reasonably) to add resources to Kubernetes manifests.
E.g.:
resources:
  limits:
    cpu: "1"
    memory: "512Mi"
I’ve been spending time with Deislab’s Akri and decided to determine whether Akri’s primary resources (Agent, Controller) and some of my creations HTTP Device and Discovery, were being suitably constrained.
Posts
read more
Deploying a Rust HTTP server to DigitalOcean App Platform
DigitalOcean launched an App Platform with many Supported Languages and Frameworks. I used Golang first, then wondered how to use non-natively-supported languages, i.e. Rust.
The good news is that Docker is a supported framework and so, you can run pretty much anything.
Repo: https://github.com/DazWilkin/do-apps-rust
Rust
I’m a Rust noob. I’m always receptive to feedback on improvements to the code. I looked to mirror the Golang example. I’m using rocket and rocket-prometheus for the first time:
You will want to install rust nightly (as Rocket has a dependency that requires it) and then you can override the default toolchain for the current project using:
Posts
read more
Google Home Exporter
I’m obsessing over Prometheus exporters. First came Linode Exporter, then GCP Exporter and, on Sunday, I stumbled upon a reverse-engineered API for Google Home devices and so wrote a very basic Google Home SDK and a similarly basic Google Home Exporter:
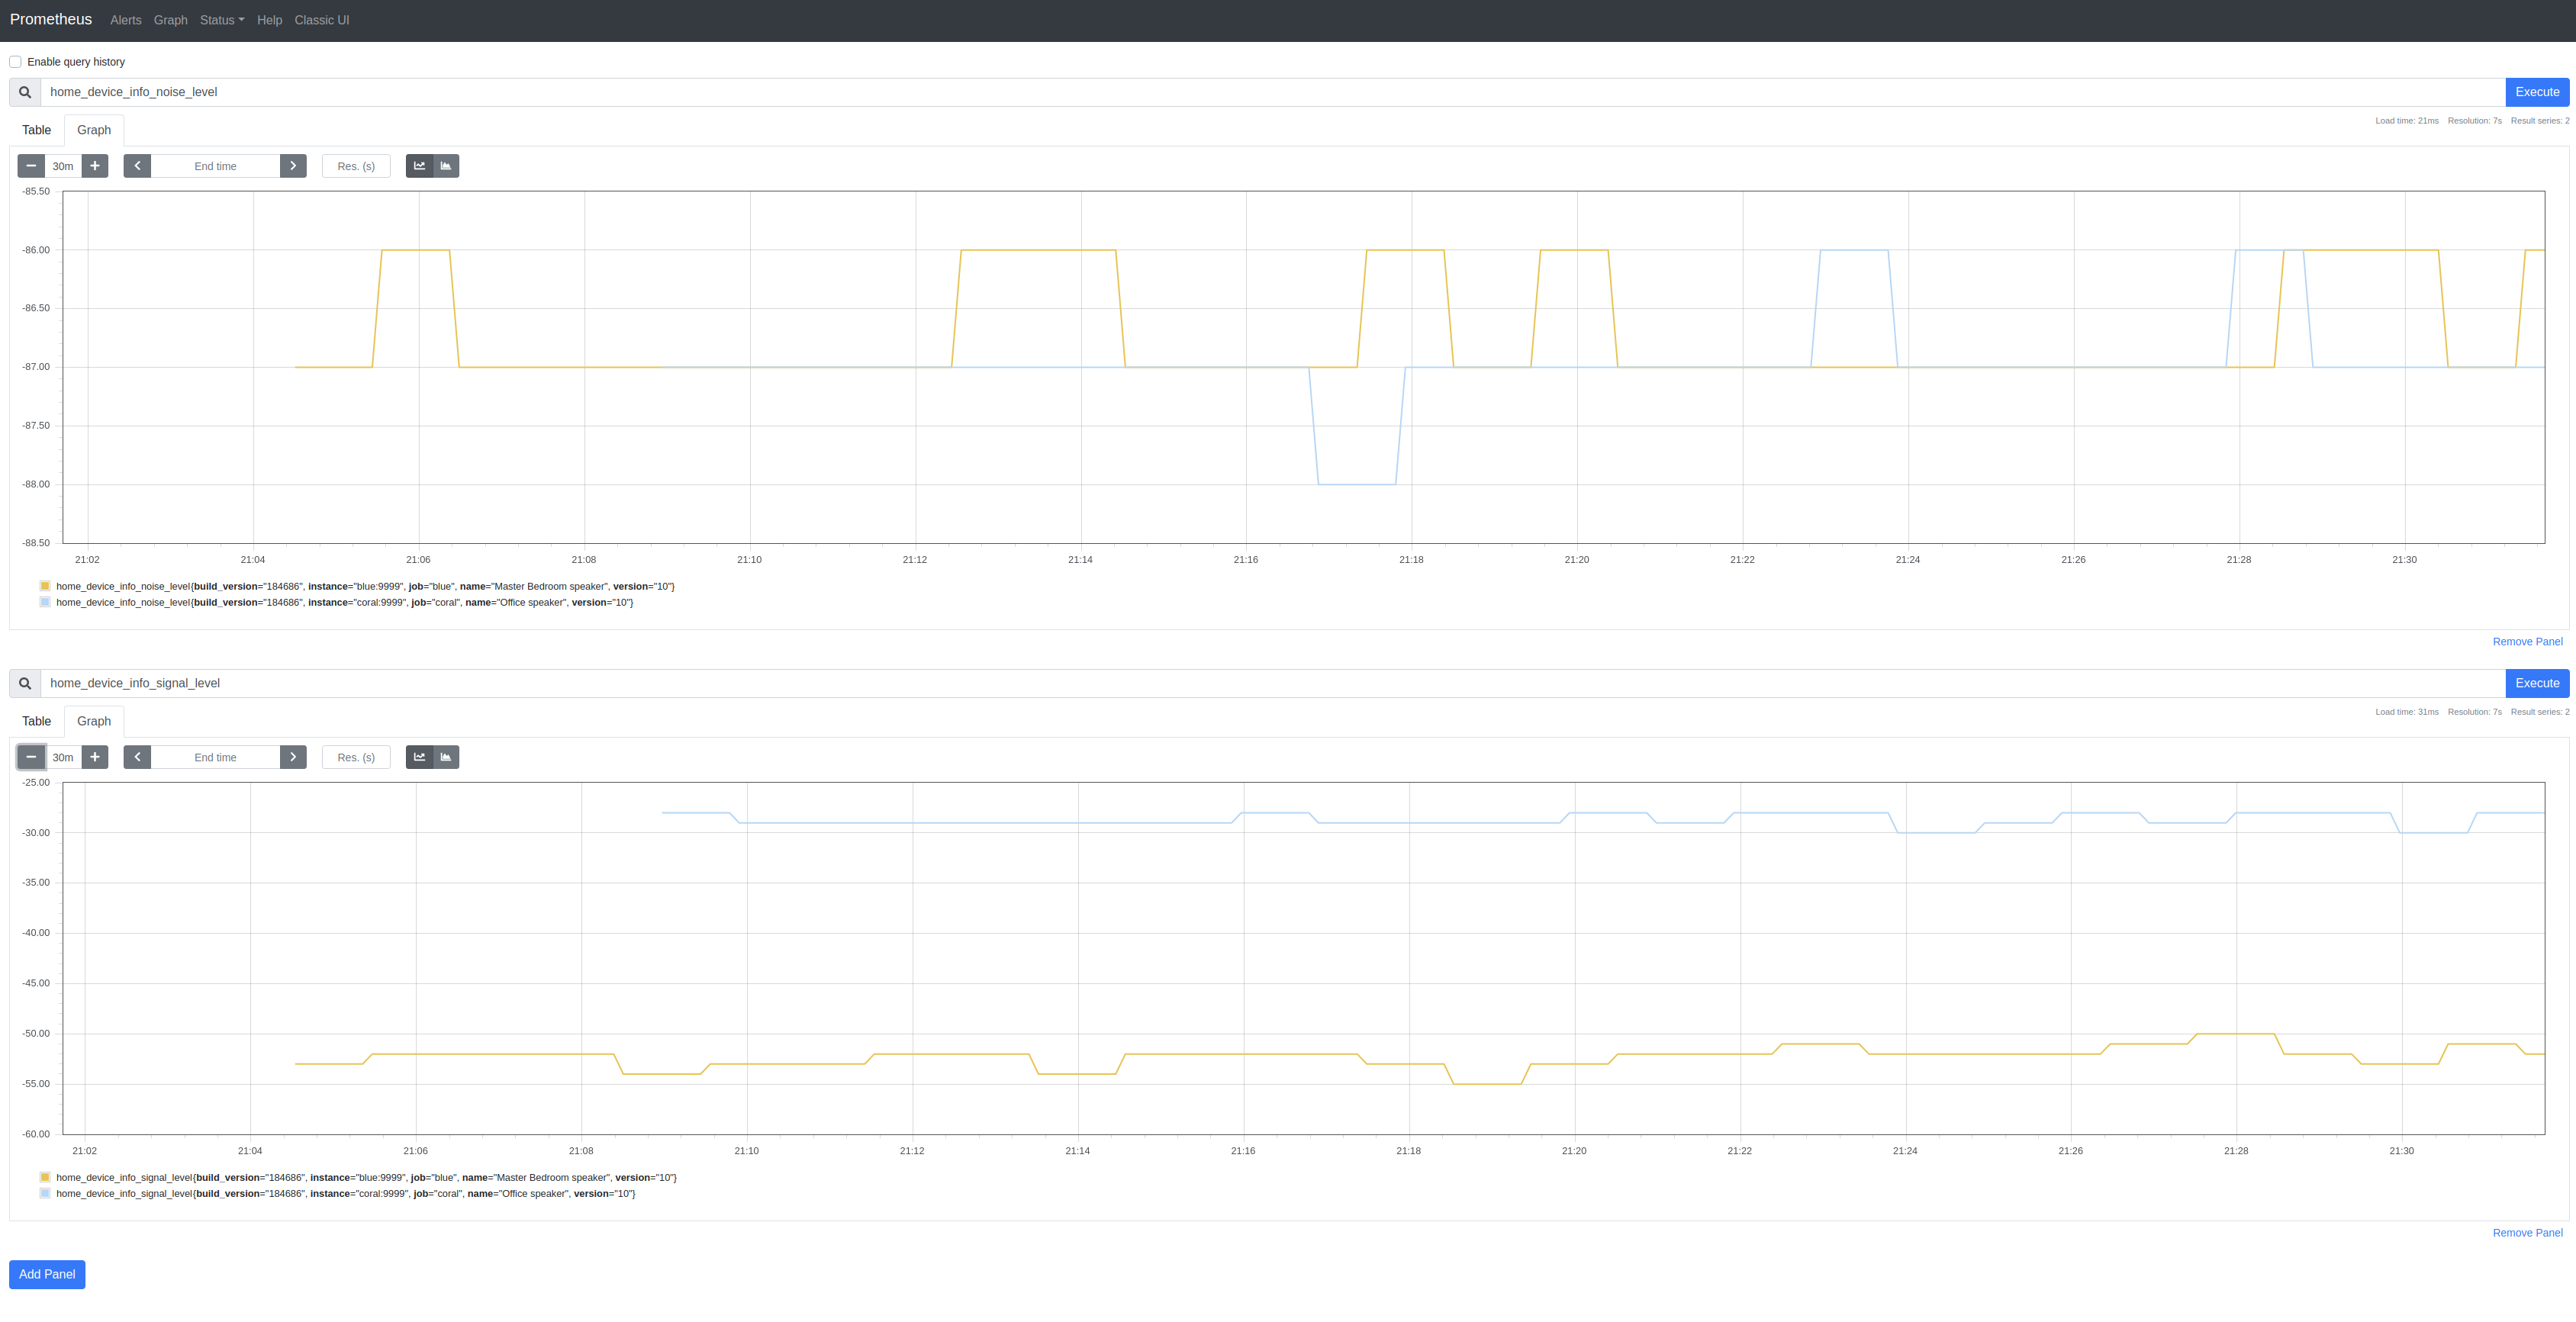
The SDK only implements /setup/eureka_info and then only some of the returned properties. There’s not a lot of metric-like data to use besides SignalLevel (signal_level) and NoiseLevel (noise_level). I’m not clear on the meaning of some of the properties.
Posts
read more
Google Cloud Platform (GCP) Exporter
Earlier this week I discussed a Linode Prometheus Exporter.
I added metrics for Digital Ocean’s Managed Kubernetes service to @metalmatze’s Digital Ocean Exporter.
This left, metrics for Google Cloud Platform (GCP) which has, for many years, been my primary cloud platform. So, today I wrote Prometheus Exporter for Google Cloud Platform.
All 3 of these exporters follow the template laid down by @metalmatze and, because each of these services has a well-written Golang SDK, it’s straightforward to implement an exporter for each of them.
Posts
read more
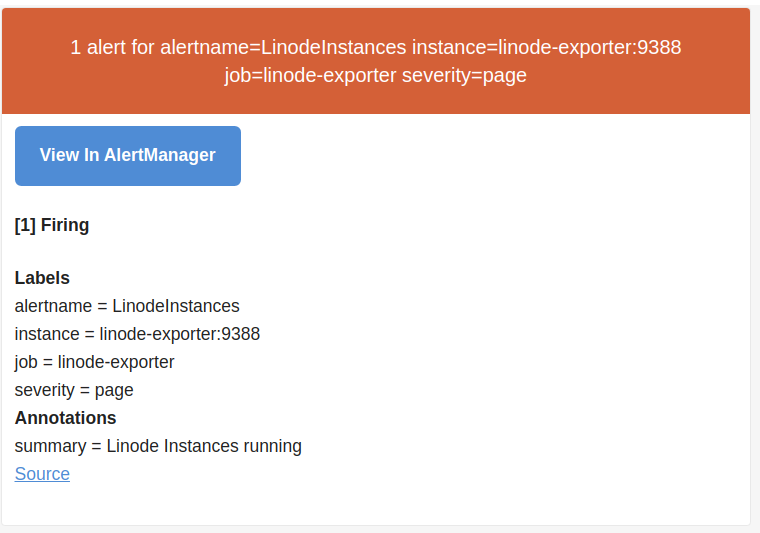
Prometheus AlertManager
Yesterday I discussed a Linode Prometheus Exporter and tantalized use of Prometheus AlertManager.
Success:
Configure
The process is straightforward although I found the Prometheus (config) documentation slightly unwieldy to navigate :-(
The overall process is documented.
Here are the steps I took:
Configure Prometheus
Added the following to prometheus.yml:
rule_files:
- "/etc/alertmanager/rules/linode.yml"

alerting:
  alertmanagers:
    - scheme: http
      static_configs:
        - targets:
            - "alertmanager:9093"
Rules must be defined in separate rules files. See below for the content for linode.yml and an explanation.
Posts
read more
Linode Prometheus Exporter
I enjoy using Prometheus and have toyed around with it for some time particularly in combination with Kubernetes. I signed up with Linode [referral] compelled by the addition of a managed Kubernetes service called Linode Kubernetes Engine (LKE). I have an anxiety that I’ll inadvertently leave resources running (unused) on a cloud platform. Instead of refreshing the relevant billing page, it struck me that Prometheus may (not yet proven) help.
The hypothesis is that a combination of a cloud-specific Prometheus exporter reporting aggregate uses of e.g. Linodes (instances), NodeBalancers, Kubernetes clusters etc., could form the basis of an alert mechanism using Prometheus’ alerting.