Prometheus VPA Recommendations
- 7 minutes read - 1348 wordsPhew!
I was interested in learning how to Manage Resources for Containers. On the way, I learned and discovered:
kubectl top- Vertical Pod Autoscaler
- A (valuable) digression through PodMonitor
kube-state-metrics- `kubectl-patch
- Created a Graph
- References
Kubernetes Resources
Visual Studio Code has begun to bug me (reasonably) to add resources to Kubernetes manifests.
E.g.:
resources:
  limits:
    cpu: "1"
    memory: "512Mi"
I’ve been spending time with Deislab’s Akri and decided to determine whether Akri’s primary resources (Agent, Controller) and some of my creations HTTP Device and Discovery, were being suitably constrained.
None of them are.
The immediate question is, what CPU and memory requests and limits should I use?
kubectl top
kubectl top is proposed:
kubectl top pods \
--namespace=akri-system

NAME                        CPU(cores)   MEMORY(bytes)
akri-agent-dhm4s            0m           14Mi
akri-controller-vlvvv       0m           5Mi
akri-http-discovery-v4dfn   0m           4Mi
akri-http-0d65a6-pod        1m           6Mi
akri-http-1daa25-pod        1m           7Mi
akri-http-286fb9-pod        1m           6Mi
akri-http-31f1eb-pod        1m           5Mi
akri-http-464fa2-pod        1m           6Mi
metrics-server
To get instrumentation for kubectl top, you must be running metrics-server
I’m using MicroK8s and installing metrics-server is as simple as:
microk8s enable metrics-server
Check the metrics-server repo for installation instructions if you’re not use MicroK8s.
Vertical Pod Autoscaler (VPA)
Daniel’s Vertical Pod Autoscaler deep dive is very helpful. I recommend it.
I was unfamiliar with this tool.
I’m becoming reacquainted with Helm (partly through the Akri project) and, while still find the tool a little over-wrought, dropping the cluster-side tiller has been good and, I will admit, it’s probably the best way to deploy applications to clusters.
MicroK8s (1.20) includes an older version of Helm so I’ve switched to aliasing helm3 to the Helm team’s container image:
microk8s.helm3 version
version.BuildInfo{Version:"v3.0.2", GitCommit:"19e47ee3283ae98139d98460de796c1be1e3975f", GitTreeState:"clean", GoVersion:"go1.13.5"}

VERS="3.5.2"
alias helm3="docker run \
--interactive --tty --rm \
--volume=${HOME}/.kube:/root/.kube \
--volume=${PWD}/.helm:/root/.helm \
--volume=${PWD}/.config/helm:/root/.config/helm \
--volume=${PWD}/.cache/helm:/root/.cache/helm \
--volume=${PWD}/akri/deployment:/apps \
alpine/helm:${VERS}"
There’s a Helm chart (for everything) including VPA thanks to the Fairwinds team:
https://github.com/FairwindsOps/charts/tree/master/stable/vpa
NOTE Fairwinds provides a tool called Goldilocks which is VPA plus some UI tooling.
You can:
helm3 repo add fairwinds-stable https://charts.fairwinds.com/stable
"fairwinds-stable" has been added to your repositories

helm3 repo update

NAMESPACE="vpa-system"
helm3 install vpa fairwinds-stable/vpa \
--namespace=${NAMESPACE} \
--create-namespace
Once VPA is installed, it’s configured by creating VerticalPodAutoscaler Kinds.
Since I mentioned Akri, here are two VerticalPodAutoscaler manifests (Example). The first for Akri’s Agent (DaemonSet) and the second for Akri’s Controller (Deployment). VerticalPodAutoscalers are created in the Namespace where the resources reside. In this case, where I’ve deployed Akri in the akri-system namespace.
These are defined with UpdateMode: "Off" because I want them to calculate recommendations but not enforce them:
echo '
apiVersion: autoscaling.k8s.io/v1
kind: VerticalPodAutoscaler
metadata:
  name: akri-agent
spec:
  targetRef:
    apiVersion: "apps/v1"
    kind:       DaemonSet
    name:       akri-agent-daemonset
  updatePolicy:
    updateMode: "Off"
' | kubectl apply --filename=- --namespace=akri-system

echo '
apiVersion: autoscaling.k8s.io/v1
kind: VerticalPodAutoscaler
metadata:
  name: akri-controller
spec:
  targetRef:
    apiVersion: "apps/v1"
    kind:       Deployment
    name:       akri-controller-deployment
  updatePolicy:
    updateMode: "Off"
' | kubectl apply --filename=- --namespace=akri-system
After a short time, you can query these to see what recommendations have been calculated:
kubectl get vpa \
--namespace=akri-system \
--output=jsonpath="{.items[*].status.recommendation}" \
| jq -r .
Yields:
{
  "containerRecommendations": [
    {
      "containerName": "akri-agent",
      "lowerBound": {
        "cpu": "15m",
        "memory": "104857600"
      },
      "target": {
        "cpu": "15m",
        "memory": "104857600"
      },
      "uncappedTarget": {
        "cpu": "15m",
        "memory": "104857600"
      },
      "upperBound": {
        "cpu": "521m",
        "memory": "1118671679"
      }
    }
  ]
}
{
  "containerRecommendations": [
    {
      "containerName": "akri-controller",
      "lowerBound": {
        "cpu": "15m",
        "memory": "104857600"
      },
      "target": {
        "cpu": "15m",
        "memory": "104857600"
      },
      "uncappedTarget": {
        "cpu": "15m",
        "memory": "104857600"
      },
      "upperBound": {
        "cpu": "521m",
        "memory": "545693548"
      }
    }
  ]
}
Very useful!
So, I got to thinking, can I monitor these in Prometheus?
Why, yes, you can but…
Digression: PodMonitor
Daniel’s blog mentions that the recommender exposes (Prometheus) metrics.
kubectl get deployment/vpa-recommender \
--namespace=vpa-system \
--output=jsonpath="{.spec.template.spec.containers[?(@.name=='vpa')].ports}" \
| jq .
Yields:
[
  {
    "containerPort": 8942,
    "name": "metrics",
    "protocol": "TCP"
  }
]
And, if you port-forward to this, you can indeed see Prometheus metrics:
kubectl port-forward deployment/vpa-recommender \
--namespace=vpa-system \
8942:8942
And then:
curl --silent localhost:8942/metrics \
| grep "TYPE vpa_recommender[_a-z]*"
# TYPE vpa_recommender_aggregate_container_states_count gauge
# TYPE vpa_recommender_execution_latency_seconds histogram
# TYPE vpa_recommender_recommendation_latency_seconds histogram
# TYPE vpa_recommender_vpa_objects_count gauge
But, after digressing on this for a while, I realized this isn’t what I want. There’s insufficient detail here.
I did learn about the Prometheus Operator’s [PodMonitor]s though. I discovered that you can create these to surface resources in Prometheus’ service discovery which is very clever:
kubectl get podmonitor/vpa-recommender \
--namespace=vpa-system \
--output=yaml
Yields:
apiVersion: monitoring.coreos.com/v1
kind: PodMonitor
metadata:
  name: vpa-recommender
spec:
  podMetricsEndpoints:
  - path: /metrics
    port: metrics
  selector:
    matchLabels:
      app.kubernetes.io/component: recommender
      app.kubernetes.io/instance: vpa
Prometheus
For what follows, we will need Prometheus. I highly recommend the Prometheus Operator and, if you’re using MicroK8s, you can deploy this trivially using:
microk8s enable prometheus
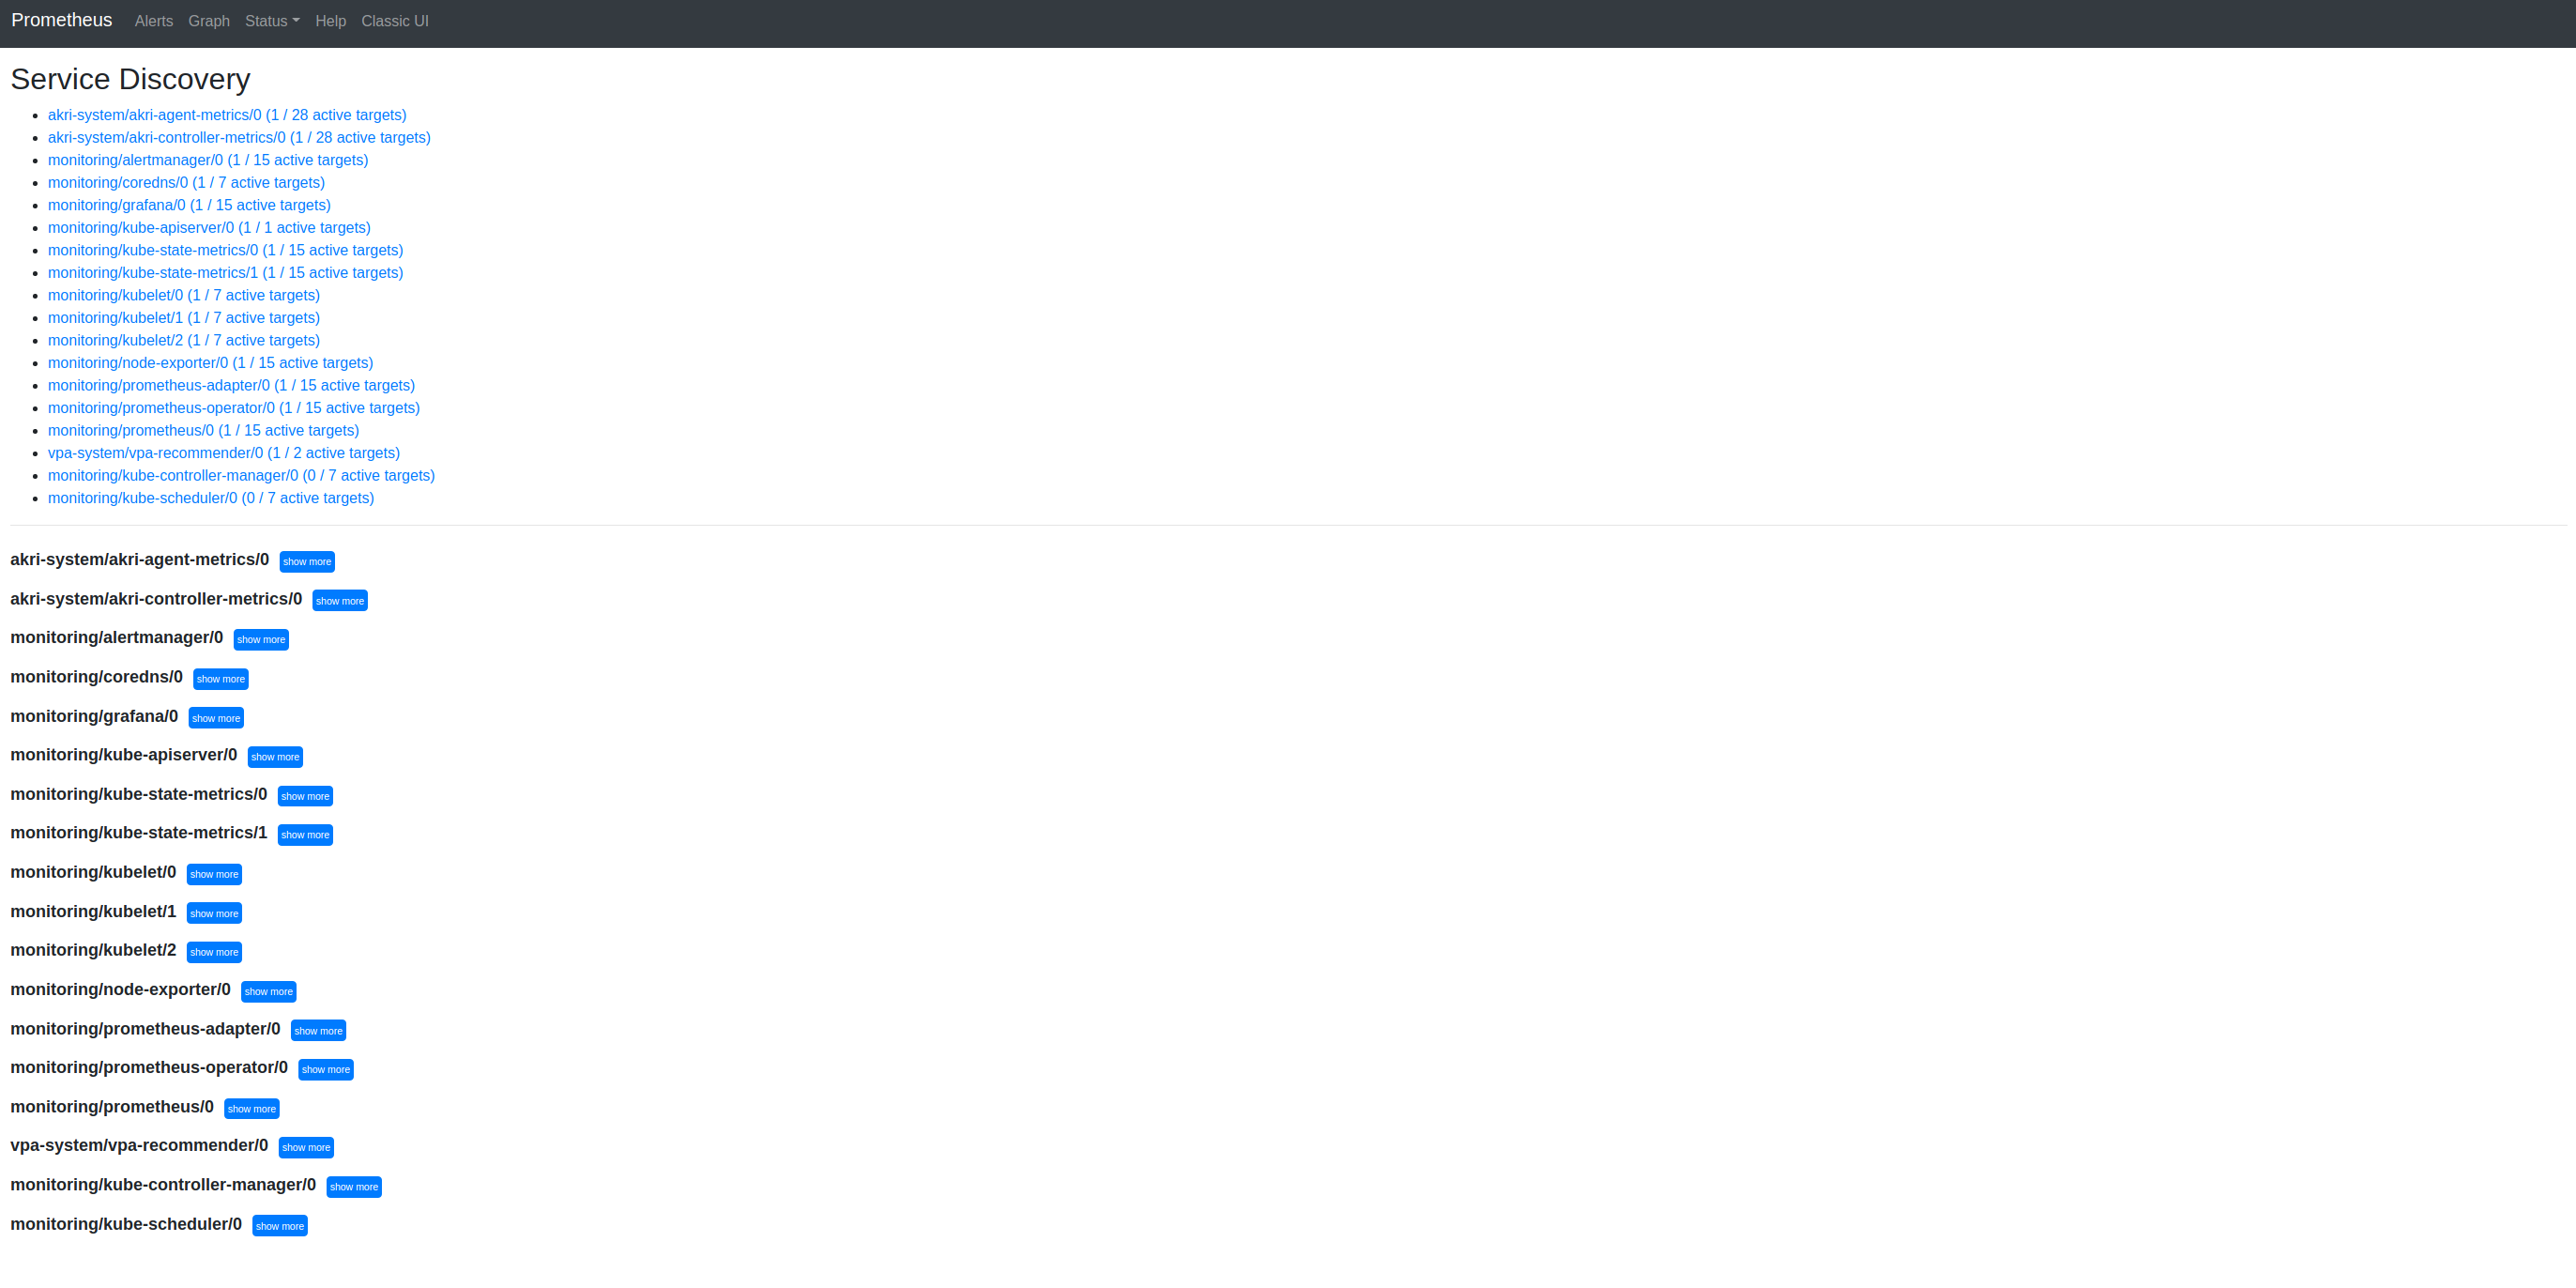
NOTE This includes Grafana and – as I learned after another digression –
kube-state-metrics. If only I’d looked more closely at the service discovery page (see below) and noticed themonitoring/kube-state-metricsentries!
kube-state-metrics
It turns out that what I really need is kube-state-metrics
LESSON
metrics-serverandkube-state-metricsare different
metrics-server(https://github.com/kubernetes-sigs/metrics-server)kube-state-metrics(https://github.com/kubernetes/kube-state-metrics)Explained here:
kube-state-metricsvs.metrics-server
I cloned the kube-state-metrics repo and deployed the ./examples/standard but was unable to get Prometheus to enumerate metrics for VPA that should be prefixed kube_verticalpodautoscaler. Eventually, I realized that I was using a duplicate kube-state-metrics in kube-system and I could simply use the kube-state-metrics in monitoring that came with the Prometheus Operator!
LESSON
kube-state-metricsis bundled with the Prometheus Operator but it needs to reconfigured.
kube-state-metrics includes metrics for Vertical Pod Autoscaler (note). The documentation states that these are disabled by default and require a specific version (v1beta2) of the VPA CRDs.
Fortunately, I was good on the CRD versions:
kubectl get crd/verticalpodautoscalers.autoscaling.k8s.io \
--output=jsonpath="{.spec.versions[*].name}"
v1beta1 v1beta2 v1
But:
kubectl logs deployment/kube-state-metrics \
--namespace=monitoring \
--container=kube-state-metrics

...
Active resources:
  certificatesigningrequests,configmaps,cronjobs,
  daemonsets,deployments,endpoints,horizontalpodautoscalers,
  ingresses,jobs,leases,limitranges,mutatingwebhookconfigurations,
  namespaces,networkpolicies,nodes,persistentvolumeclaims,
  persistentvolumes,poddisruptionbudgets,pods,replicasets,
  replicationcontrollers,resourcequotas,secrets,services,
  statefulsets,storageclasses,validatingwebhookconfigurations,
  volumeattachments
...
The list of Active resources does not include verticalpodautoscalers probably because these are disabled by default (per the docs).
Double-checking on Prometheus’ UI (:9090) expression browser, I was able to enumerate some kube_ metrics from kube-state-metrics but none kube_verticalpodautoscaler_.
The issue is that the kube-state-metrics Deployment as deployed by the Operator is not configured to use verticalpodautoscalers; it does not include verticalpodautoscalers in its resources flag as defined by the CLI:
kubectl get deployment/kube-state-metrics \
--namespace=monitoring \
--output=jsonpath="{.spec.template.spec.containers[?(@.name=='kube-state-metrics')]}" \
| jq .
Yields:
{
  "args": [
    "--host=127.0.0.1",
    "--port=8081",
    "--telemetry-host=127.0.0.1",
    "--telemetry-port=8082",
  ],
  "image": ".../kube-state-metrics:v1.9.7",
  "imagePullPolicy": "IfNotPresent",
  "name": "kube-state-metrics",
  "resources": {},
  "terminationMessagePath": "/dev/termination-log",
  "terminationMessagePolicy": "File"
}
NOTE The Operator doesn’t specify Pod
"resources": {}either :-)
I don’t understand why but the Operator deploys sidecars with this container too which complicates the next step:
kubectl get deployment/kube-state-metrics \
--namespace=monitoring \
--output=jsonpath="{.spec.template.spec.containers[*].name}"
kube-state-metrics kube-rbac-proxy-main kube-rbac-proxy-self
kubectl patch
Ideally, we want to jam a --resource=... flag into that args list and re-apply the Deployment.
The easiest way to do this if you can get it to work is to use kubectl patch and, though the documentation is confusing, I’ve previously used [JSON Patch] and find this the most powerful.
Starting with the JSONPath above (plus the bit for Args):
.spec.template.spec.containers[?(@.name=='kube-state-metrics')].args
We can convert this to JSON Patch:
.spec.template.spec.containers/0/args/-
NOTE
- JSON Patch doesn’t permit JSONPath’s array filtering so we must select the 0th
containers/0- JSON Patch provides
-to add something to the end (-) of theargsarray
We need only provide the value that we wish to add. This will be all the resources that were available by default plus verticalpodautoscalers:
RESOURCES="certificatesigningrequests,configmaps,cronjobs,"\
"daemonsets,deployments,endpoints,horizontalpodautoscalers,"\
"ingresses,jobs,leases,limitranges,mutatingwebhookconfigurations,"\
"namespaces,networkpolicies,nodes,persistentvolumeclaims,"\
"persistentvolumes,poddisruptionbudgets,pods,replicasets,"\
"replicationcontrollers,resourcequotas,secrets,services,"\
"statefulsets,storageclasses,validatingwebhookconfigurations,"\
"verticalpodautoscalers,volumeattachments"

PATCH="[{"\
"'op': 'add',"\
"'path':'/spec/template/spec/containers/0/args/-',"\
"'value':\"--resources=${RESOURCES}\"}]"


kubectl patch deployment/kube-state-metrics \
--namespace=monitoring \
--type=json \
--patch="${PATCH}"
NOTE I was unable to get
--dry-run=...to work :-(
And then:
kubectl get deployment/kube-state-metrics \
--namespace=monitoring \
--output=jsonpath="{.spec.template.spec.containers[0]}" \
| jq .
This time yields:
{
  "args": [
    "--host=127.0.0.1",
    "--port=8081",
    "--telemetry-host=127.0.0.1",
    "--telemetry-port=8082",
    "--resources=...,verticalpodautoscalers,..."
  ],
  "image": ".../kube-state-metrics:v1.9.7",
  "imagePullPolicy": "IfNotPresent",
  "name": "kube-state-metrics",
  "resources": {},
  "terminationMessagePath": "/dev/termination-log",
  "terminationMessagePolicy": "File"
}
And…
Graph
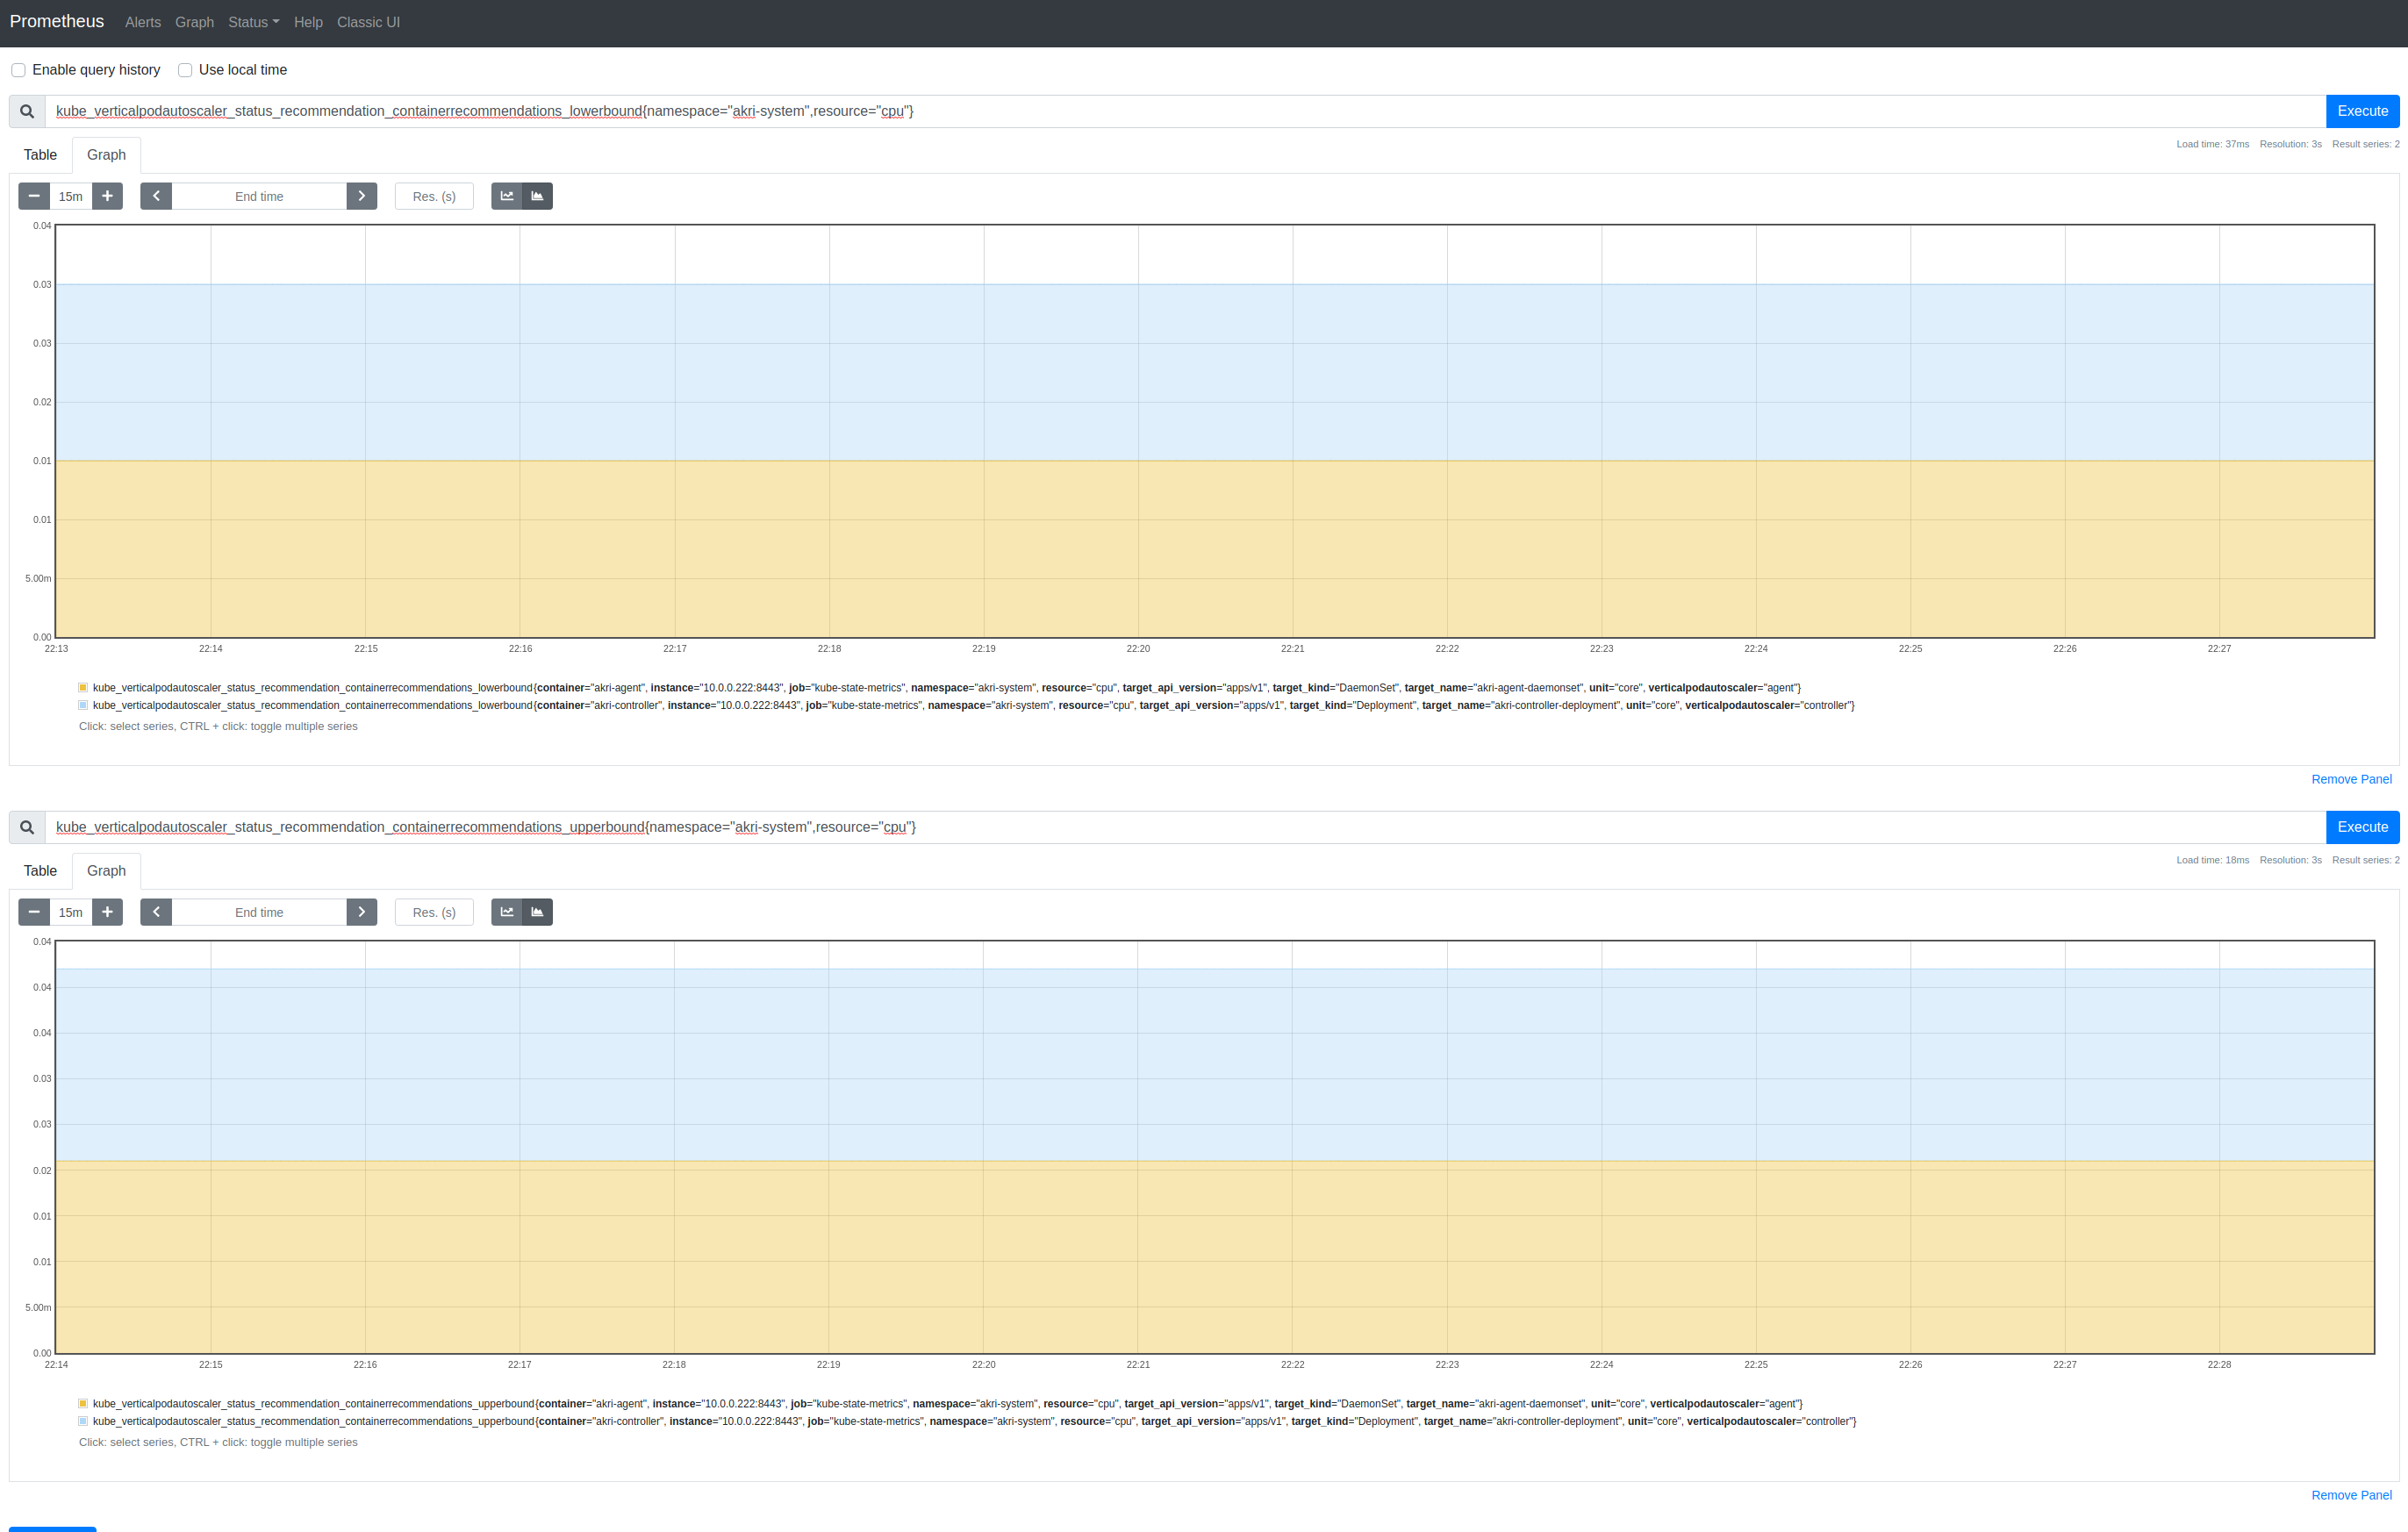
With PromQL:
kube_verticalpodautoscaler_status_recommendation_containerrecommendations_lowerbound{resource="cpu"}
kube_verticalpodautoscaler_status_recommendation_containerrecommendations_upperbound{resource="cpu"}
Which is excellent, if not terribly interesting; I should probably now put some load on the system to give it an opportunity to find some realistic values.
That’s all!
References
- Vertical Pod Autoscaler deep dive, limitations and real-world examples
- Vertical Pod Autoscaler
- JSON Patch
- JSONPath
metrics-server