Prometheus Service Discovery w/ Consul for Cloud Run
- 7 minutes read - 1341 wordsI’m working on a project that will programmatically create Google Cloud Run services and I want to be able to dynamically discover these services using Prometheus.
This is one solution.
NOTE Google Cloud Run is the service I’m using, but the principle described herein applies to any runtime service that you’d wish to use.
Why is this challenging? IIUC, it’s primarily because Prometheus has a limited set of plugins for service discovery, see the sections that include _sd_ in Prometheus Configuration documentation. Unfortunately, Cloud Run is not explicitly supported. The alternative appears to be to use file-based discovery but this seems ‘challenging’; it requires, for example, reloading Prometheus on file changes.
After contemplating the alternatives, I started by using CoreDNS and dns_sd_config but, after struggling with resolv.conf and using the 3rd-part records plugin, I gave up.
I’ve not used Consul extensively but, like many, have a high opinion of HashiCorp and was not surprised to find Consul very easy to use.
There are a few steps to test this all using Docker Compose. Fan as I am of Kubernetes, I admit that I prefer the ease of docker-compose.yml for prototyping:
- Create a
docker-compose.ymlfile - Create a
prometheus.ymlfile - Create Prometheus Graphs
Here’s my docker-compose.yml:
version: "3"

services:
  cadvisor:
    restart: always
    image: gcr.io/google-containers/cadvisor:v0.36.0
    volumes:
      - "/:/rootfs:ro"
      - "/var/run:/var/run:rw"
      - "/sys:/sys:ro"
      # Default location
      # - "/var/lib/docker/:/var/lib/docker:ro"
      # Snap location
      # - "/var/snap/docker/current:/var/lib/docker:ro"
    expose:
      - "8080"
    ports:
      - 8089:8080

  consul:
    restart: always
    image: consul:1.10.0-beta
    container_name: consul
    expose:
    - "8500" # HTTP API|UI
    ports:
    # - 8400:8400
    - 8500:8500/tcp
    - 8600:8600/udp

  prometheus:
    restart: always
    depends_on:
      - consul
    image: prom/prometheus:v2.26.0
    command:
      - --config.file=/etc/prometheus/prometheus.yml
      - --web.enable-lifecycle
    volumes:
      - ${PWD}/prometheus.yml:/etc/prometheus/prometheus.yml
    expose:
      - "9090"
    ports:
      - 9099:9090

  node-exporter-01:
    restart: always
    image: prom/node-exporter:v1.1.2
    ports:
    - 9101:9100/tcp # Prometheus Metrics (/metrics)

  node-exporter-02:
    restart: always
    image: prom/node-exporter:v1.1.2
    ports:
    - 9102:9100/tcp # Prometheus Metrics (/metrics)

  busybox:
    restart: always
    image: radial/busyboxplus:curl
    command:
    - ash
    - -c
    - |
      while true
      do
        sleep 15
      done
NOTES
If you includecadvisor, choose the correct (eitherdefaultorsnap) configuration for your Docker installation; I use the Docker Snap.
Theconsulservice only needs the DNS (UDP) ports exposed to the host (8600:8600/udp) for testing.
There are two (of the same)node-exporter-xxservices running.
The prometheus service requires prometheus.yml:
global:
  scrape_interval: 1m
  evaluation_interval: 1m

scrape_configs:
  # Consul
  - job_name: consul
    consul_sd_configs:
      - server: consul:8500
        datacenter: dc1
        tags:
        - foo

  # Self
  - job_name: "prometheus-server"
    static_configs:
      - targets:
          - "localhost:9090"

  # cAdvisor exports metrics for *all* containers running on this host
  - job_name: cadvisor
    static_configs:
      - targets:
          - "cadvisor:8080"
NOTES The only
job_namethat’s required here isconsul. In the following, sections, I’ve excluded the other two jobs for clarity.
Theserverentryconsul:8500refers to thedocker-composeservice calledconsulthat exposes port8500.
After running docker-compose up, let’s immediately browse to Prometheus’ Service Discovery page:
http://localhost:9099/service-discovery

It’s empty :-(
This is because (hopefully!), there are no services called node-exporter-XX in Consul. Let’s confirm that and then define them:
Consul includes a clear UI: http://localhost:8500/ui
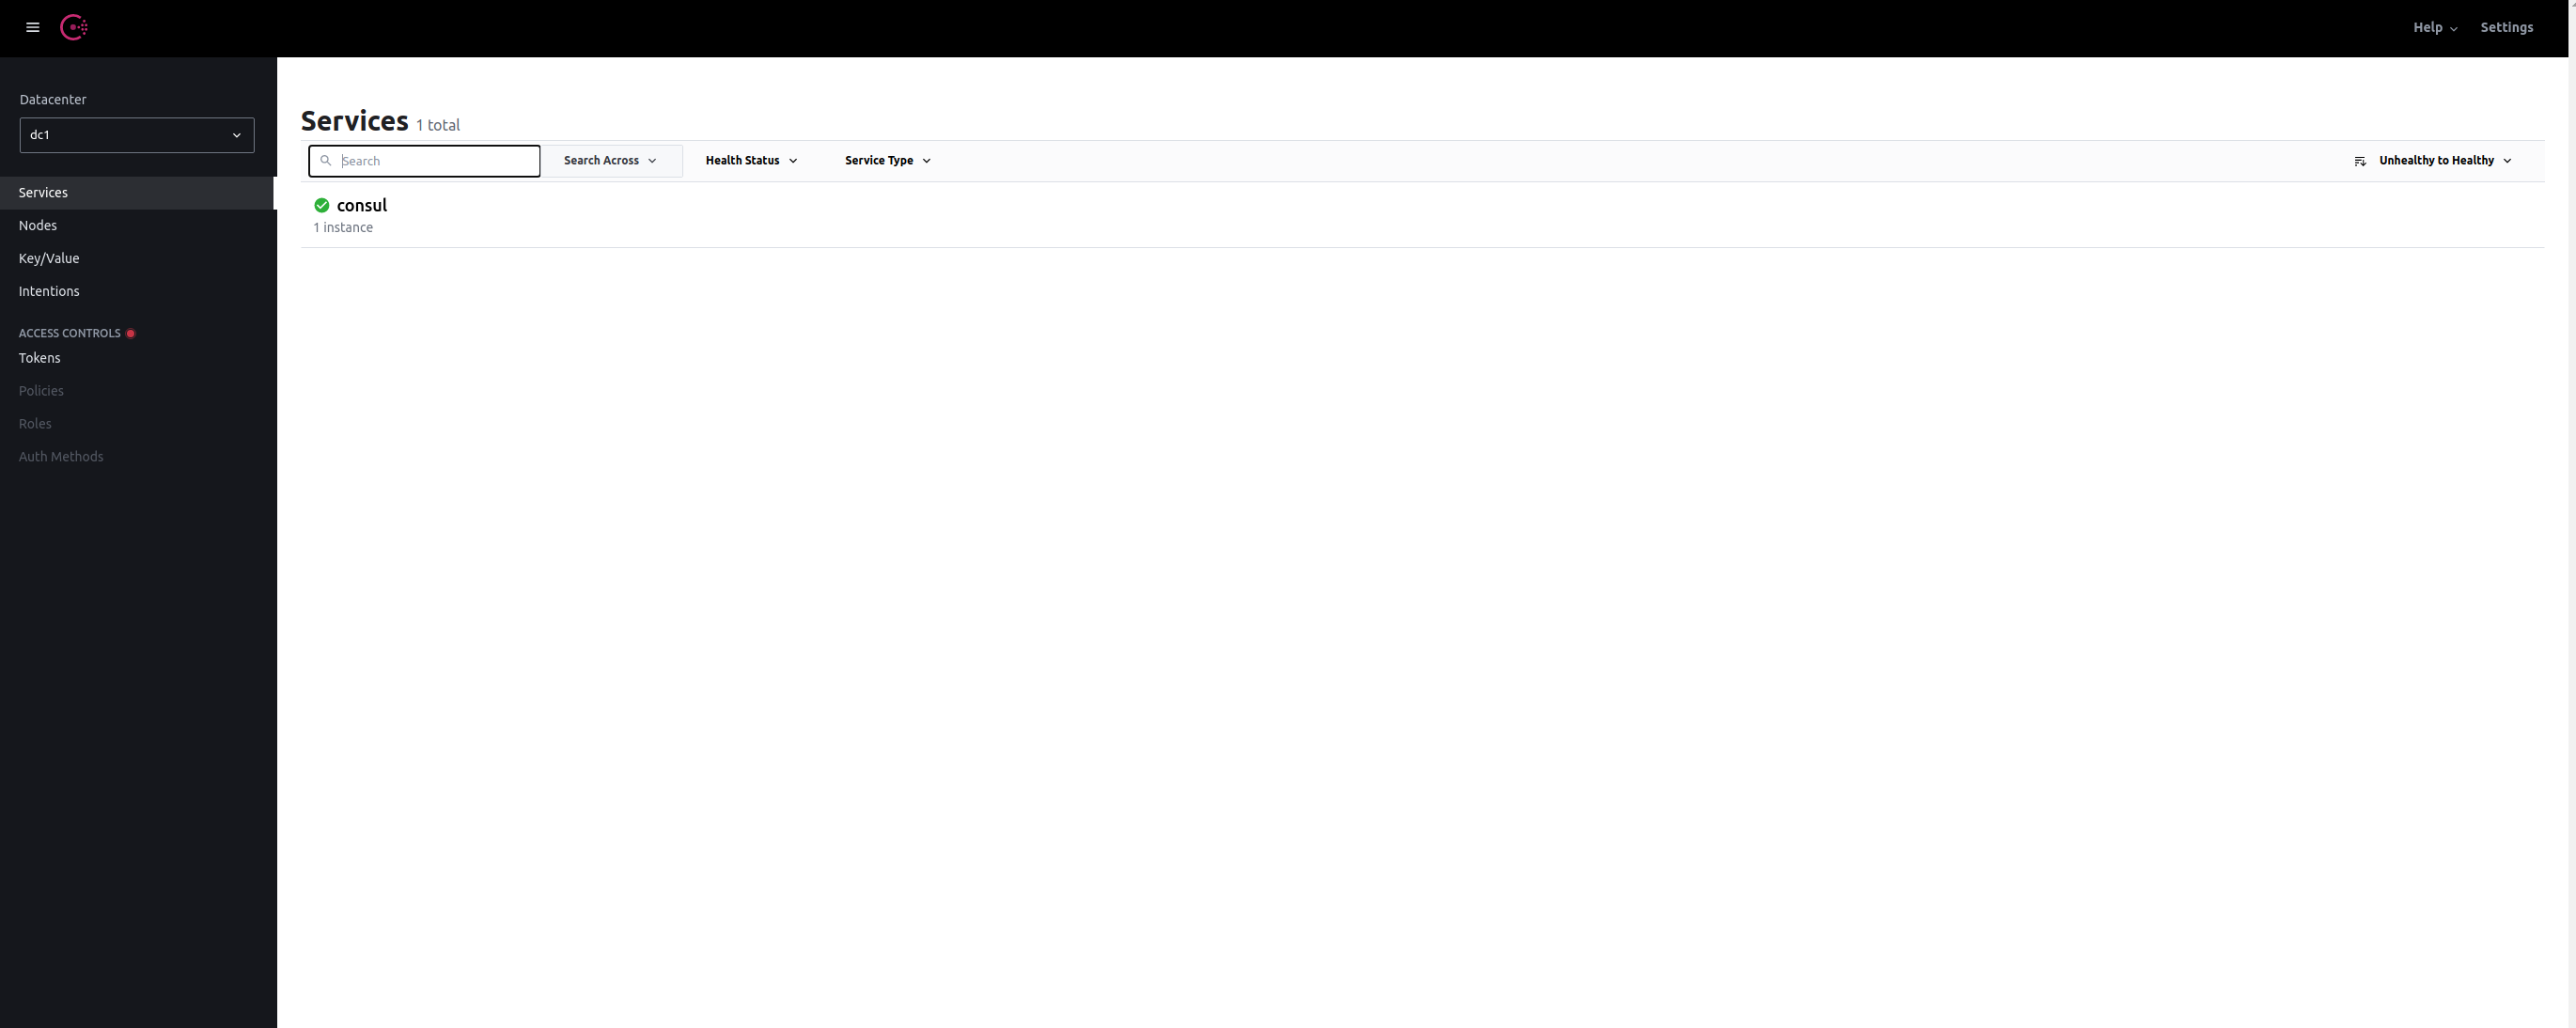
As you can see, with the exception of the default consul service, there are (as expected) no node-exporter-xx services. Let’s add these using Consul’s HTTP API:
REGISTER="http://127.0.0.1:8500/v1/agent/service/register"

for XX in {01..03}
do
  curl \
  --request PUT \
  ${REGISTER} \
  --data "{
    \"name\": \"node-exporter-${XX}\",
    \"port\":9100,
    \"tags\":[\"foo\", \"bar\"],
    \"address\": \"node-exporter-${XX}\"
  }"
done
NOTE The service
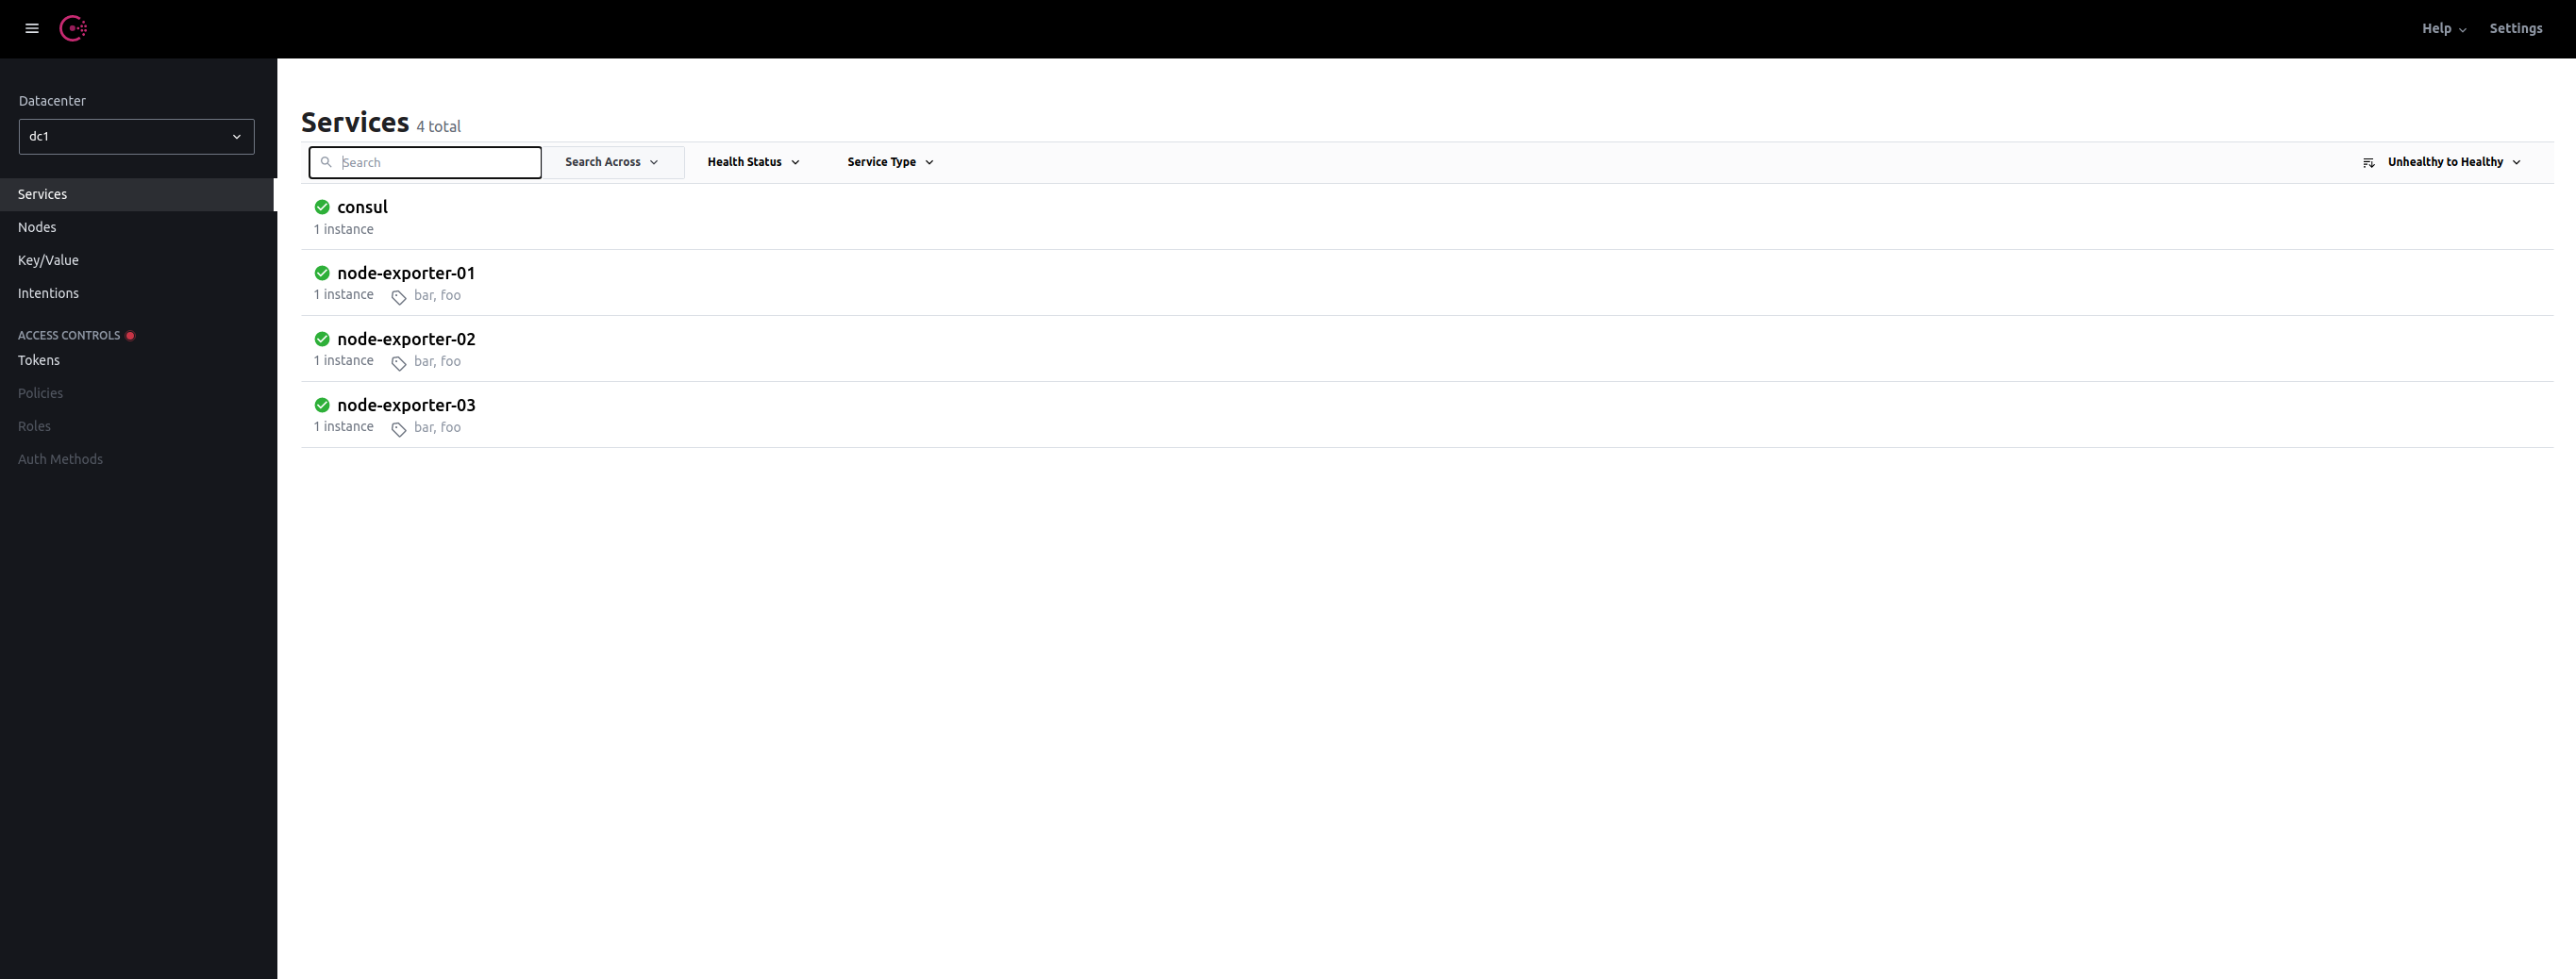
namechanges e.g.node-exporter-02but theportandaddresspoint to the docker-compose service callednode-exporterthat exposes metrics on port9100. Both services are tagged with 2 labelsfooandbar.
If we now return to the Consul UI:
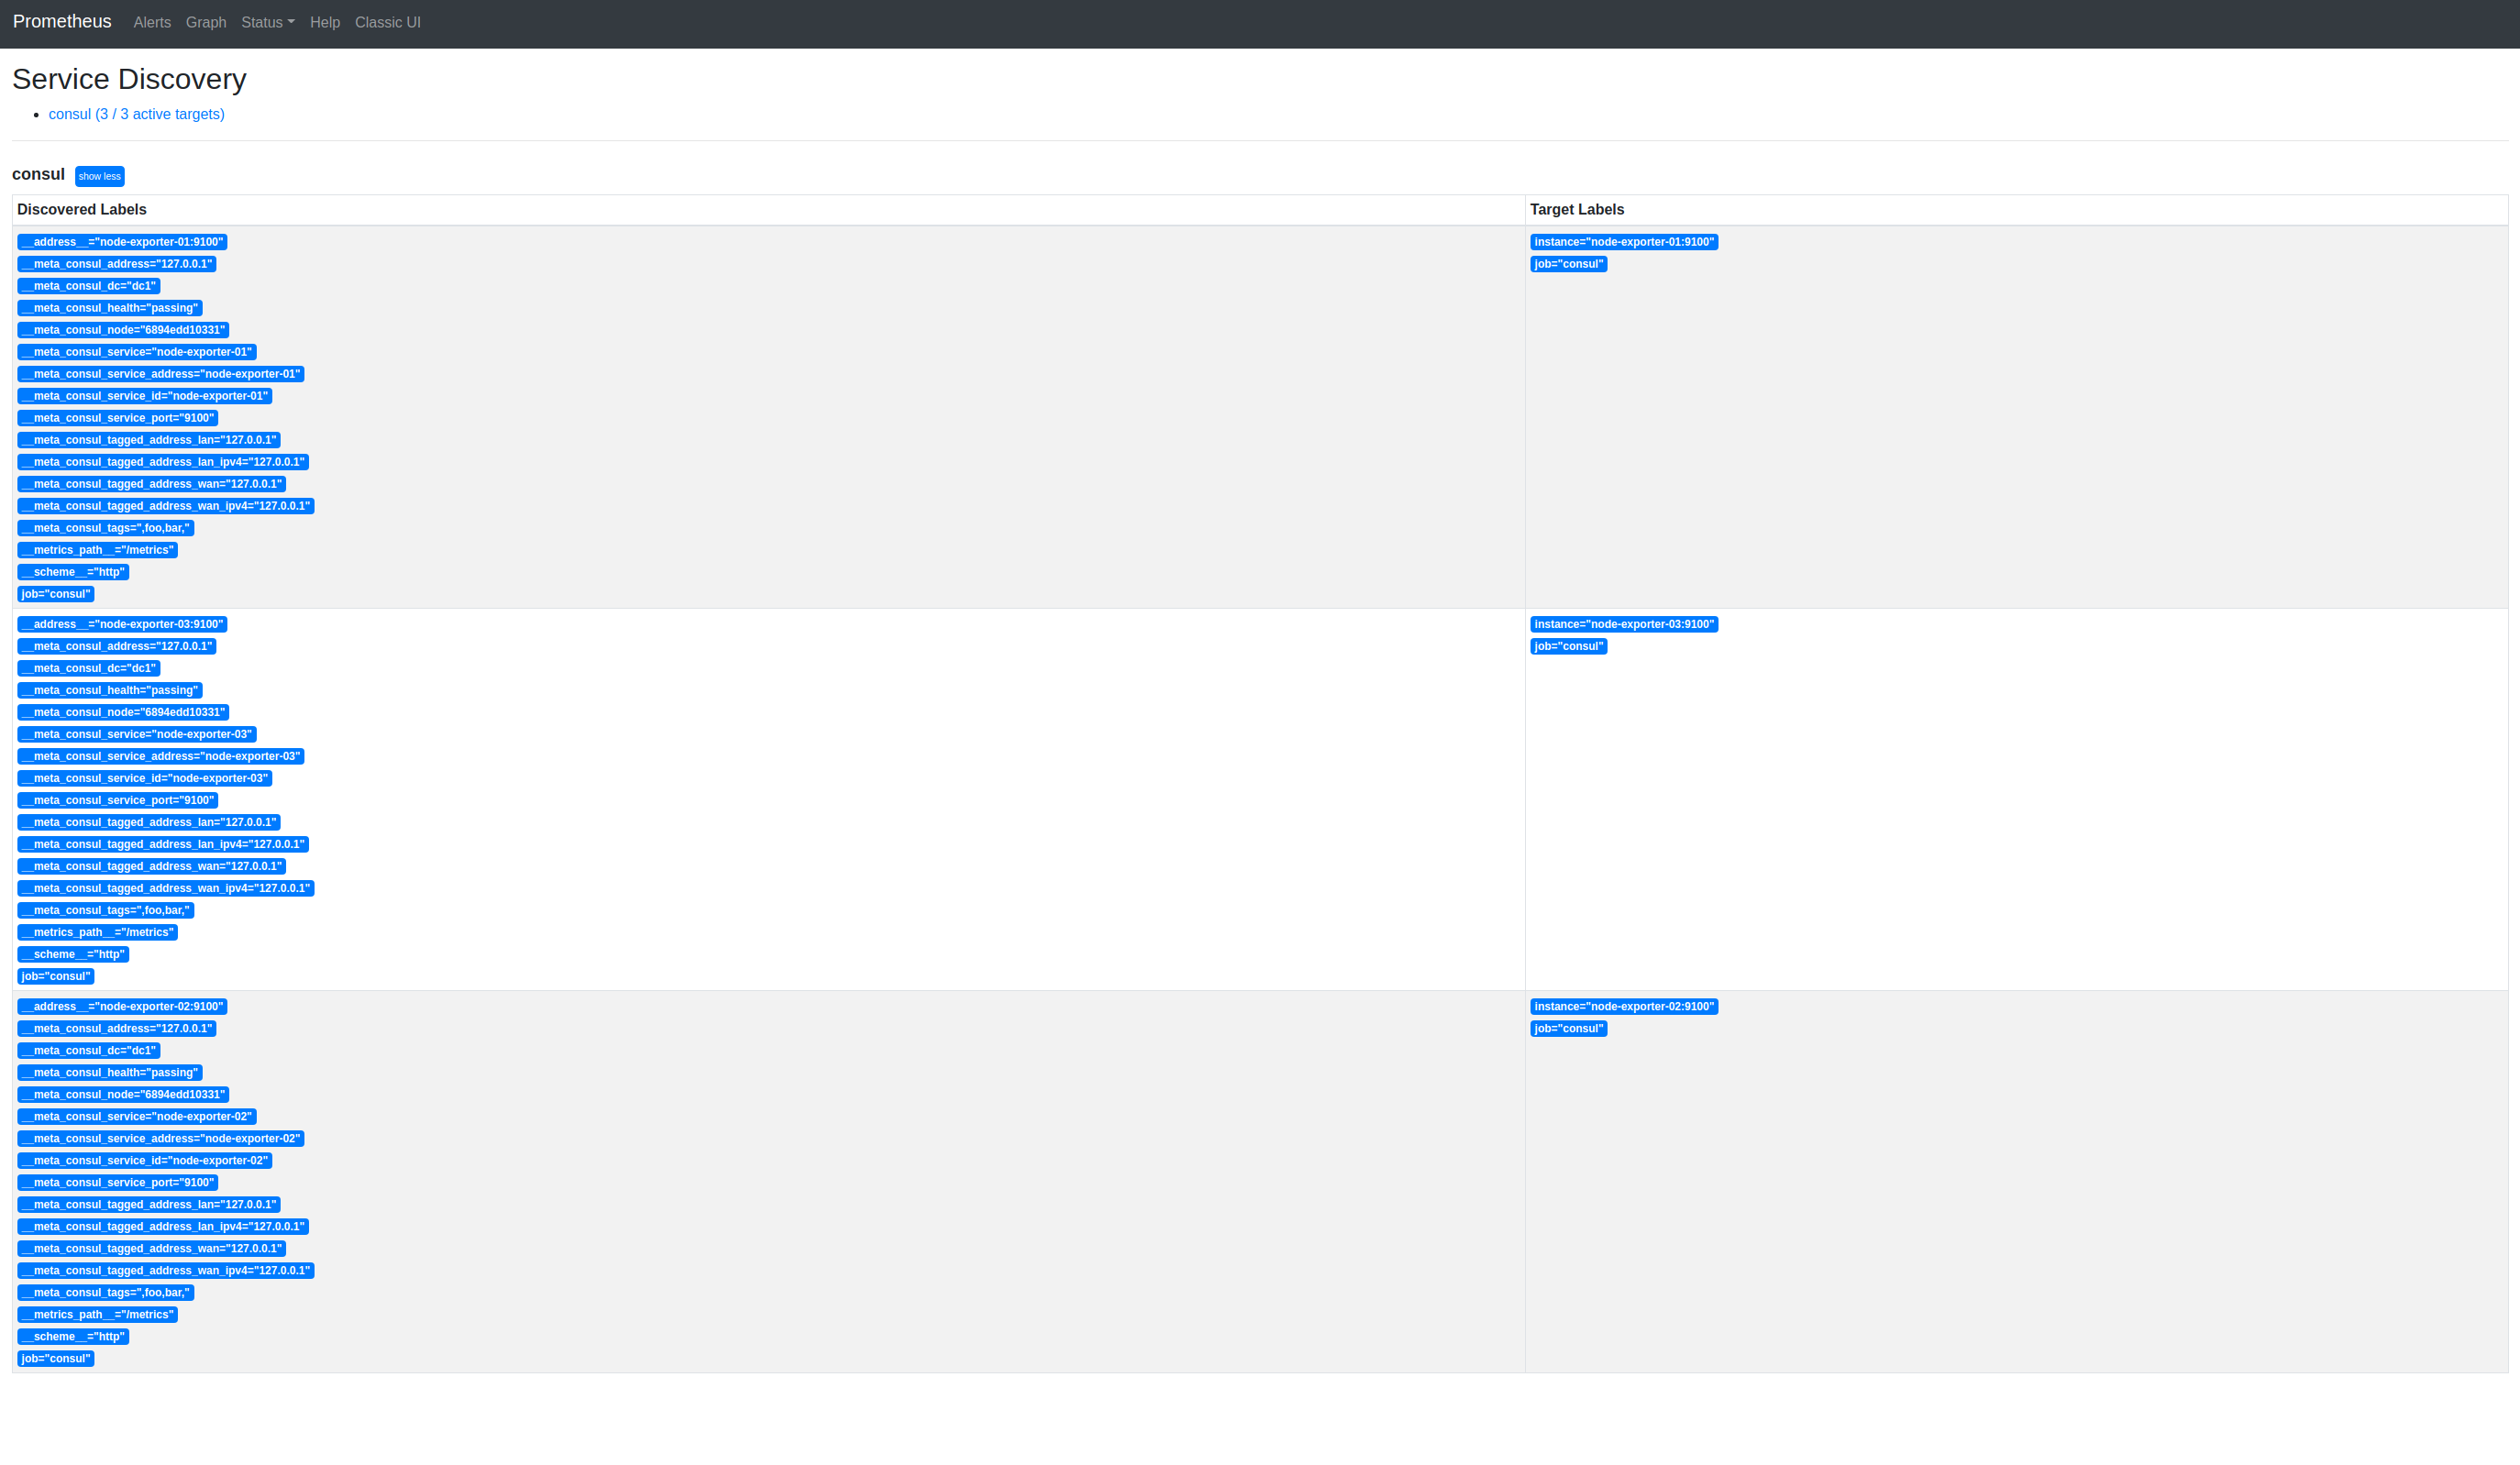
And, back to Prometheus’ Service Discovery:
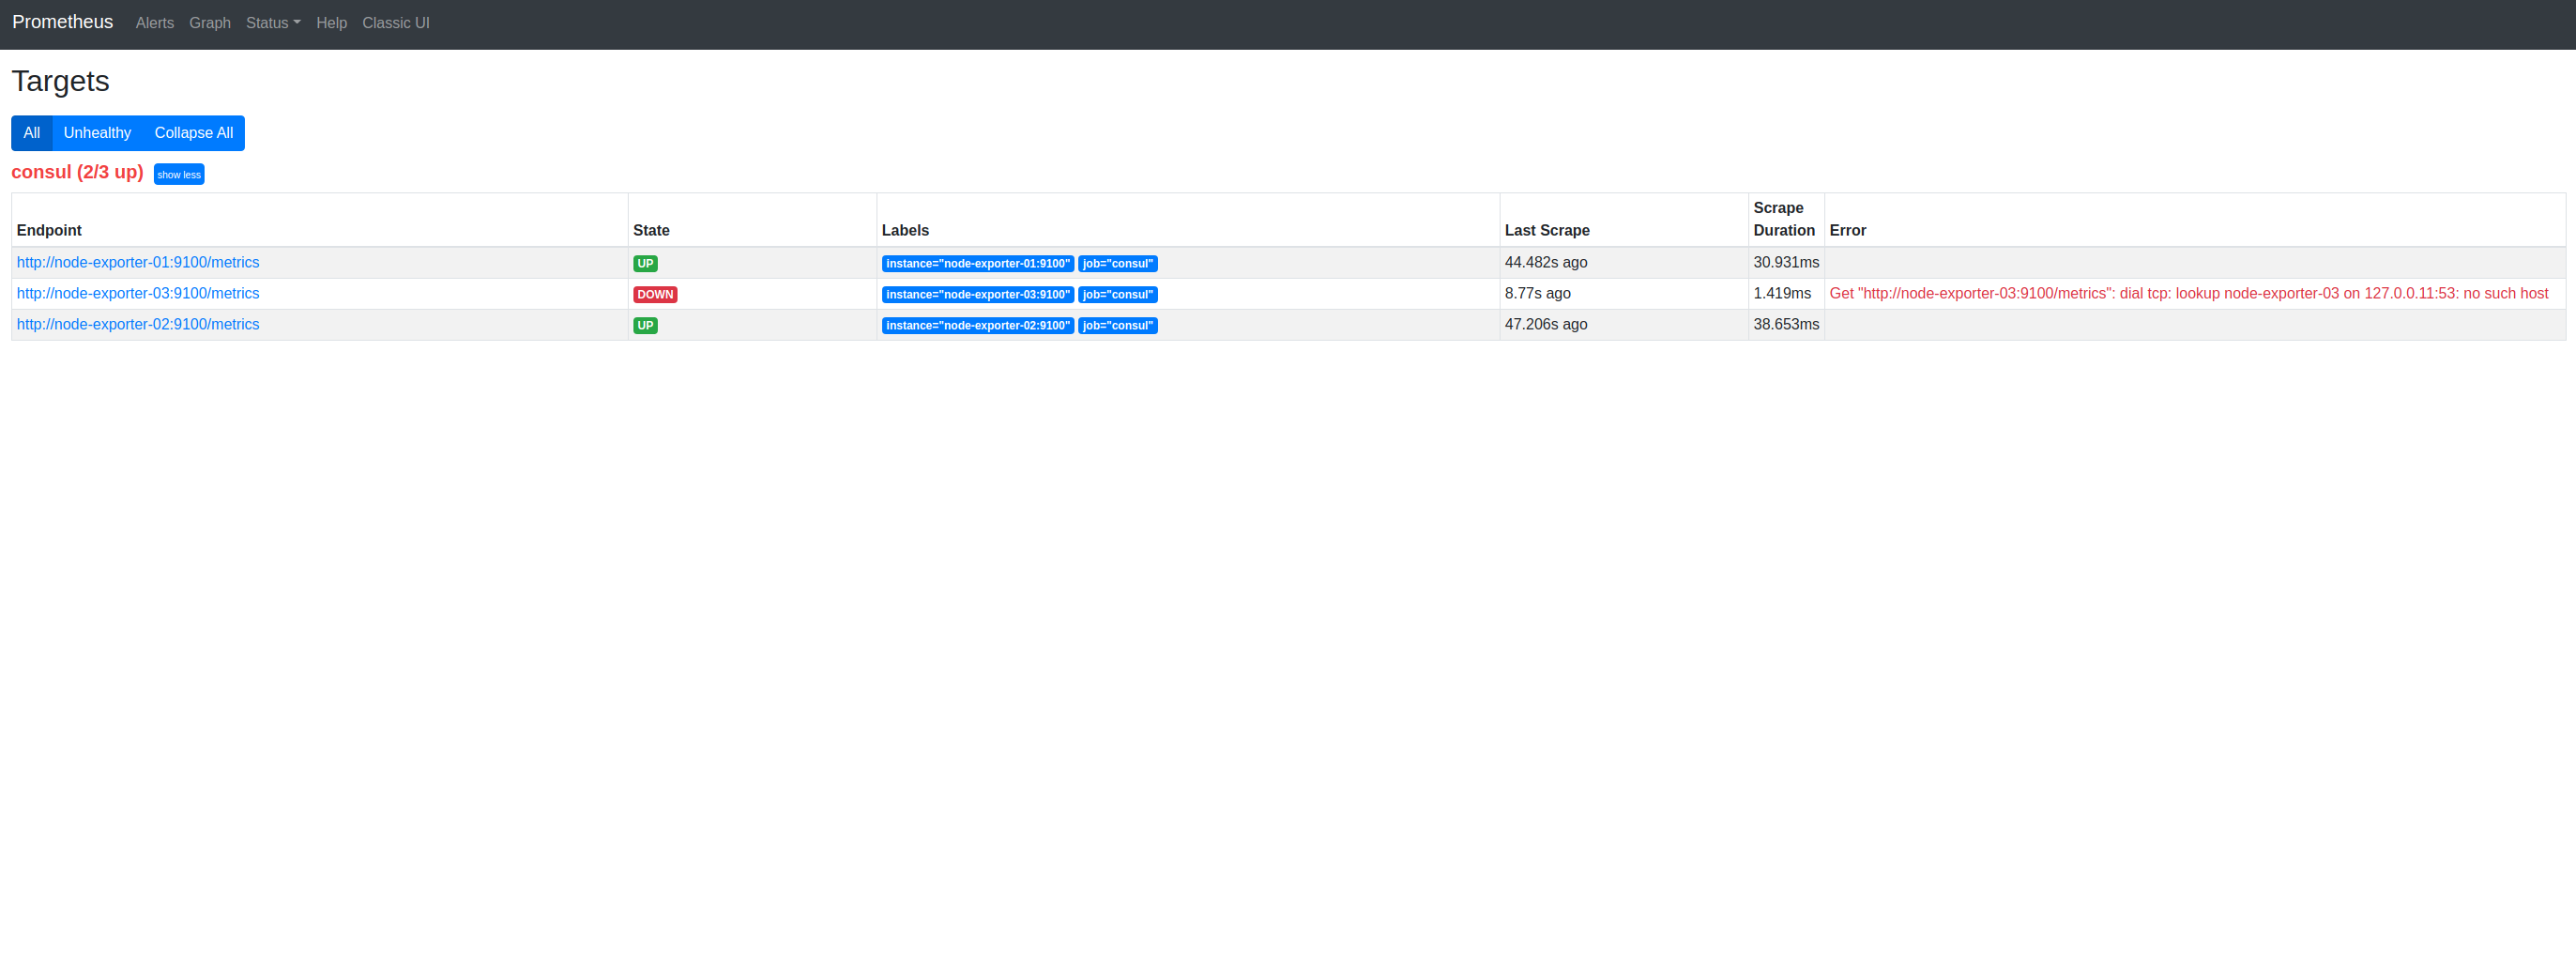
If we switch to Prometheus’ Targets, we can confirm this:
And, of course, we’re doing this primarily to observe metrics. So, let’s switch to Prometheus’ Graph UI and visualize some metrics from the Node Exporters:
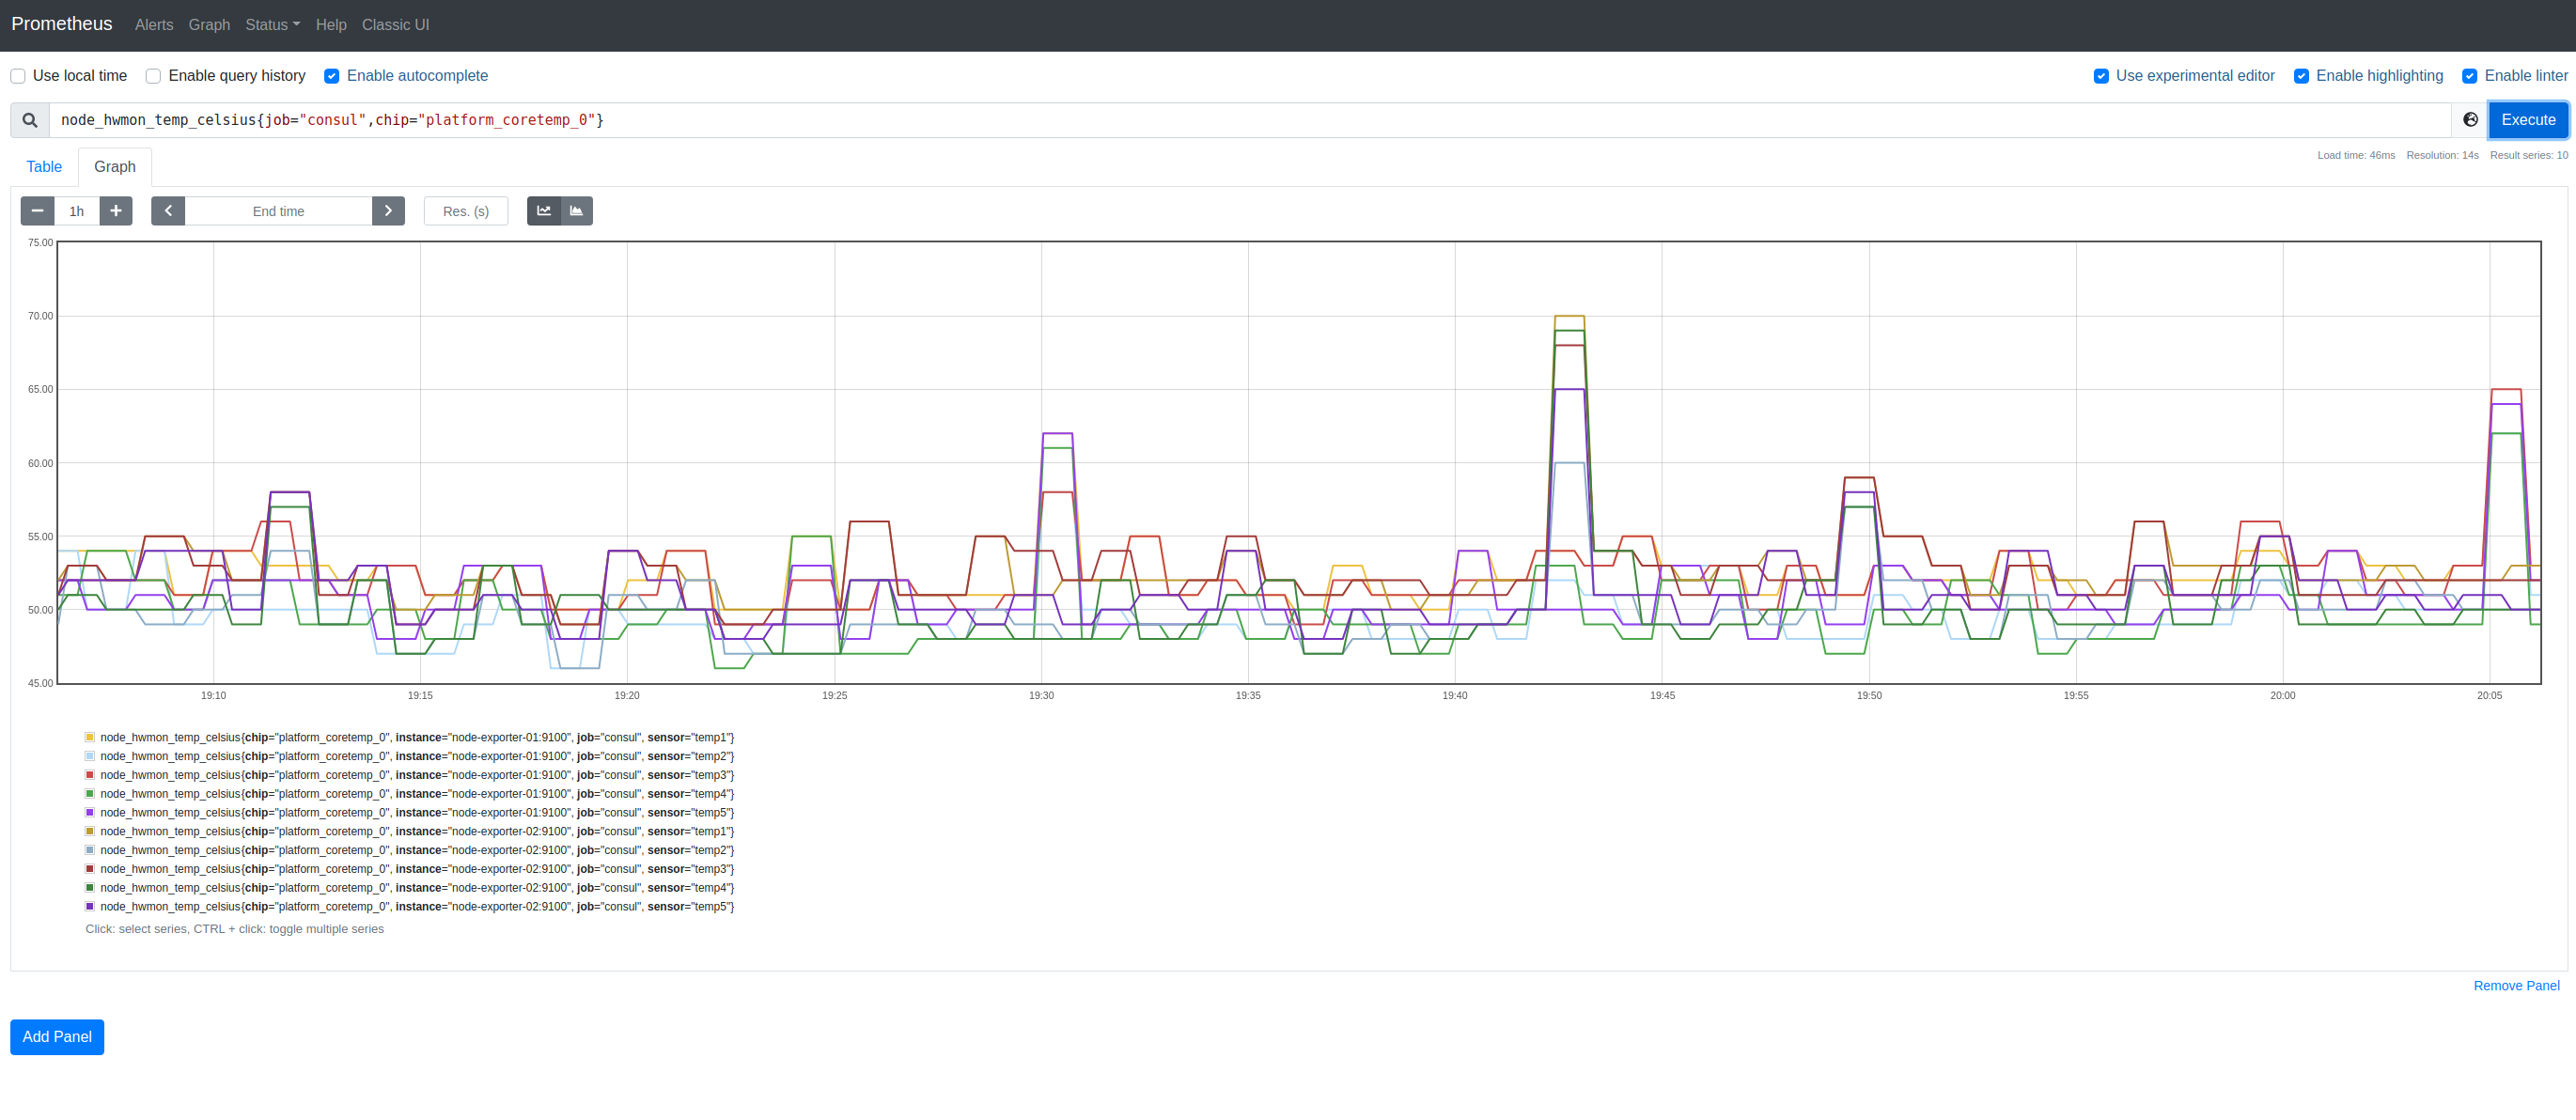
I mentioned that I’d like to use this approach to gather metrics from Cloud Run but I’ve been demonstrating how to do this using Node Exporter running locally. Let’s deploy Node Exporter to Cloud Run:
PROJECT="..."
BILLING="..."

gcloud projects create
gcloud billing

gcloud services enable run.googleapis.com --project=${PROJECT}

# Node Exporters
for XX in {01..02}
do
  gcloud run deploy node-exporter-01 \
  --max-instances=1 \
  --image=us.gcr.io/${PROJECT}/node-exporter:v1.1.2 \
  --ingress=all \
  --platform=managed \
  --port=9100 \
  --allow-unauthenticated \
  --region=${REGION} \
  --project=${PROJECT}
done
Then, we can enumerate the services with the name and location:
SERVICES=$(gcloud run services list \
  --platform=managed \
  --project=${PROJECT} \
  --format='csv(name,status.address.url)') && echo ${SERVICES}
Yielding:
node-exporter-01,https://node-exporter-01-mvgi2eemha-uw.a.run.app
node-exporter-02,https://node-exporter-02-mvgi2eemha-uw.a.run.app
And then register these services with Consul:
for SERVICE in ${SERVICES}
do
  IFS=, read NAME ENDPOINT <<< ${SERVICE}
  curl \
  --request PUT \
  ${REGISTER} \
  --data "{
    \"name\": \"${NAME}\",
    \"port\":443,
    \"tags\":[\"foo\", \"bar\"],
    \"address\": \"${ENDPOINT#https://}\"
  }"
done
NOTE We need to remove the prefixing
https://from the endpoint values using${ENDPOINT#https://}
# Check Consul
curl \
--request GET \
http://localhost:8500/v1/agent/services
Yielding:
{
    "cloud-run-01": {
        "ID": "cloud-run-01",
        "Service": "cloud-run-01",
        "Tags": [
            "foo",
            "bar"
        ],
        "Meta": {},
        "Port": 443,
        "Address": "node-exporter-01-mvgi2eemha-uw.a.run.app",
        "Weights": {
            "Passing": 1,
            "Warning": 1
        },
        "EnableTagOverride": false,
        "Datacenter": "dc1"
    },
    "cloud-run-02": {
        "ID": "cloud-run-02",
        "Service": "cloud-run-02",
        "Tags": [
            "foo",
            "bar"
        ],
        "Meta": {},
        "Port": 443,
        "Address": "node-exporter-02-mvgi2eemha-uw.a.run.app",
        "Weights": {
            "Passing": 1,
            "Warning": 1
        },
        "EnableTagOverride": false,
        "Datacenter": "dc1"
    }
}
And, we now have:
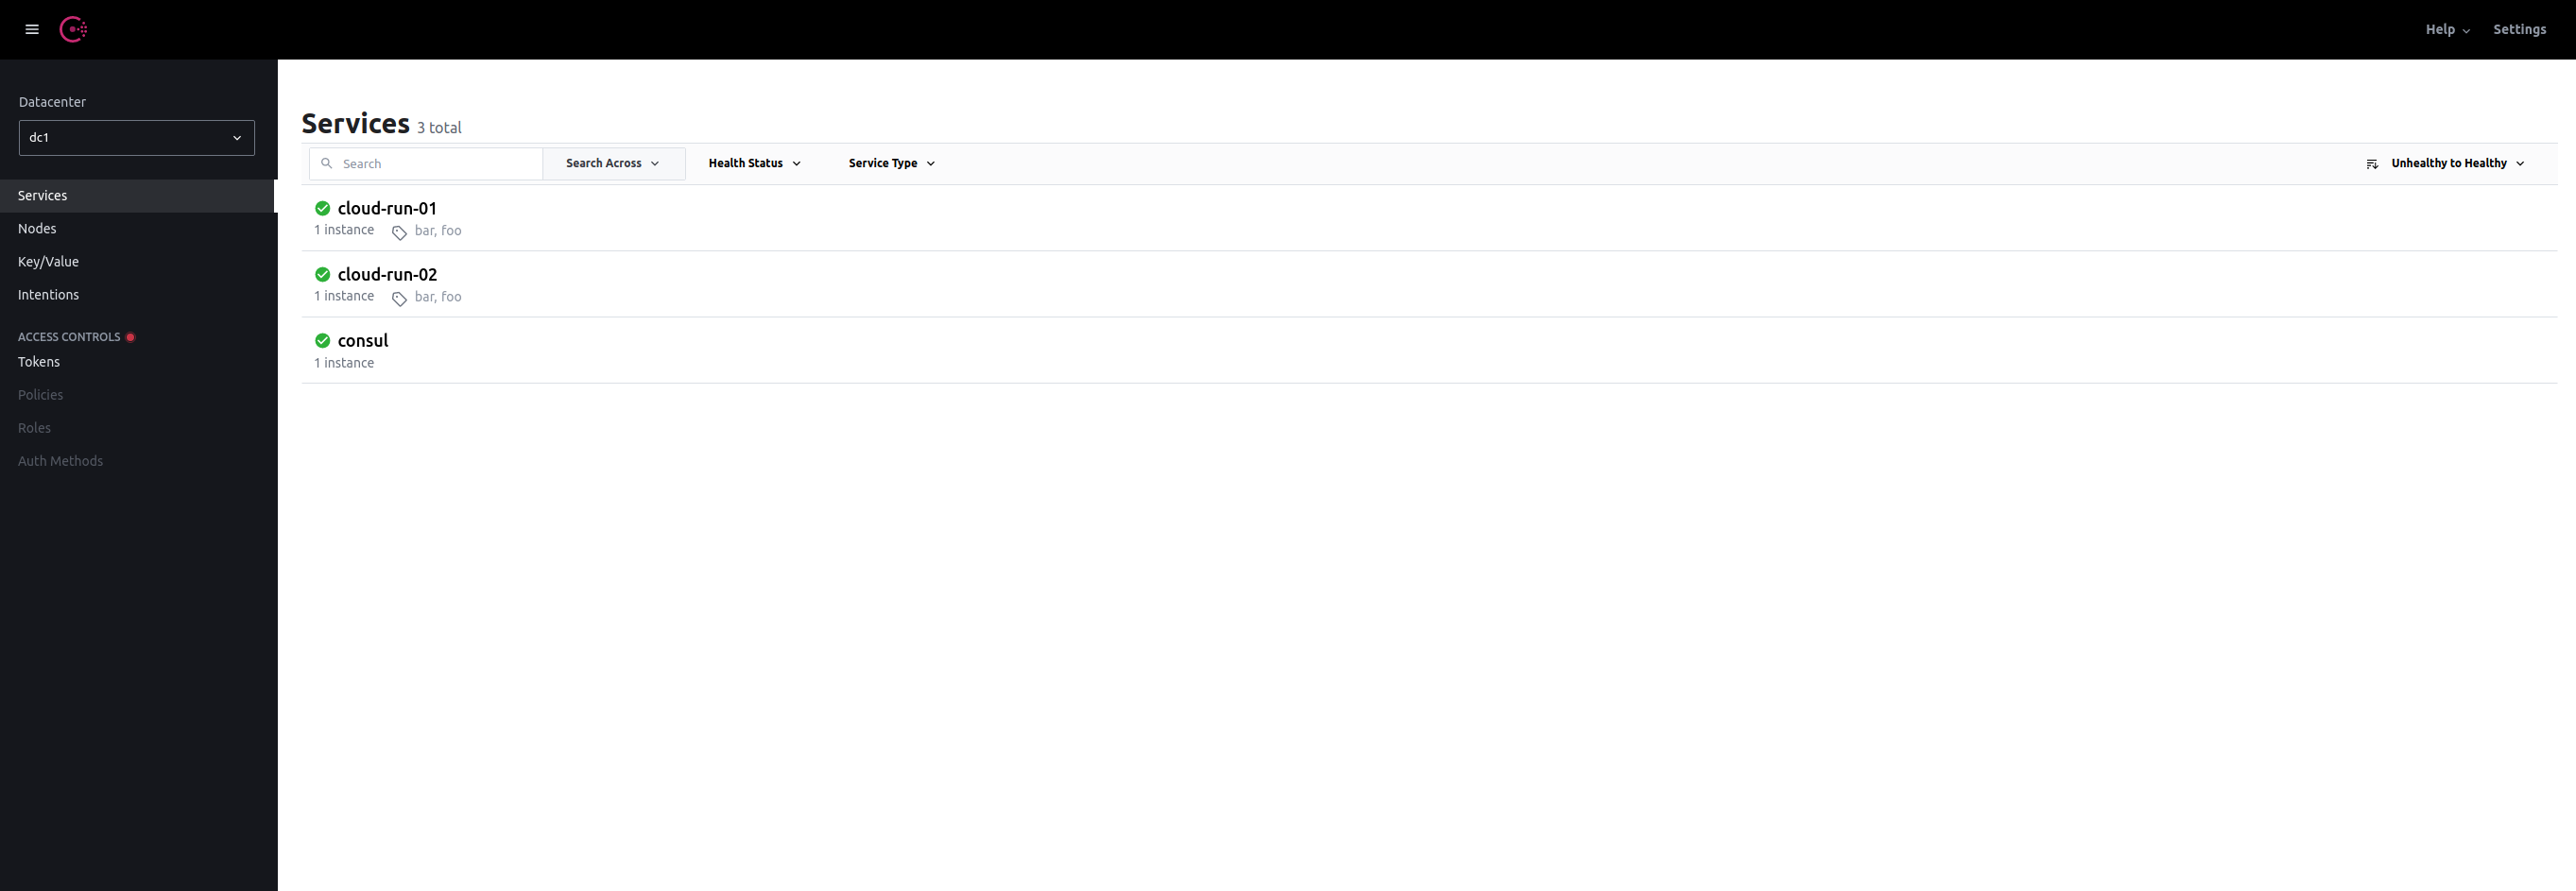
We need to revise the Prometheus config of Consul because Cloud Run endpoints use TLS. Thanks to this answer on Stackoverflow my initial, faltering attempts at understanding how to configure service discovery, became:
global:
  scrape_interval: 1m
  evaluation_interval: 1m

  # Consul: Cloud Run
  # TLS: https://stackoverflow.com/a/63356229/609290
  - job_name: cloud-run
    #metrics_path: /metrics
    tls_config:
      insecure_skip_verify: false
    consul_sd_configs:
      - server: consul:8500
        datacenter: dc1
        # services:
        #   - "cloud-run-01"
        #   - "cloud-run-02"
        tags:
        - foo
        - bar
    relabel_configs:
      - source_labels:
          - __scheme__
        target_label: __scheme__
        replacement: https
NOTES The
metrics_pathdefaults to/metricsbut is included here to better document what’s going on
Thetls_configsetsinsecure_skip_verifytofalse. This verifies (!) that the certs returned by Cloud Run are verified. It’s possible to enumerate a list ofservicesbut it’s more elegant (and dynamic) to select those services with specifictags. As shown above, when creating the services,tagsoffooandbarwere set and so these are used to filter the services discovered from Consule.
Therelabel_configsfinds the occurrences of__scheme = "http"in the labels discovered by Prometheus and rewrites these to be__scheme = "https", interestingly (!) this causes the protocol switch to TLS.
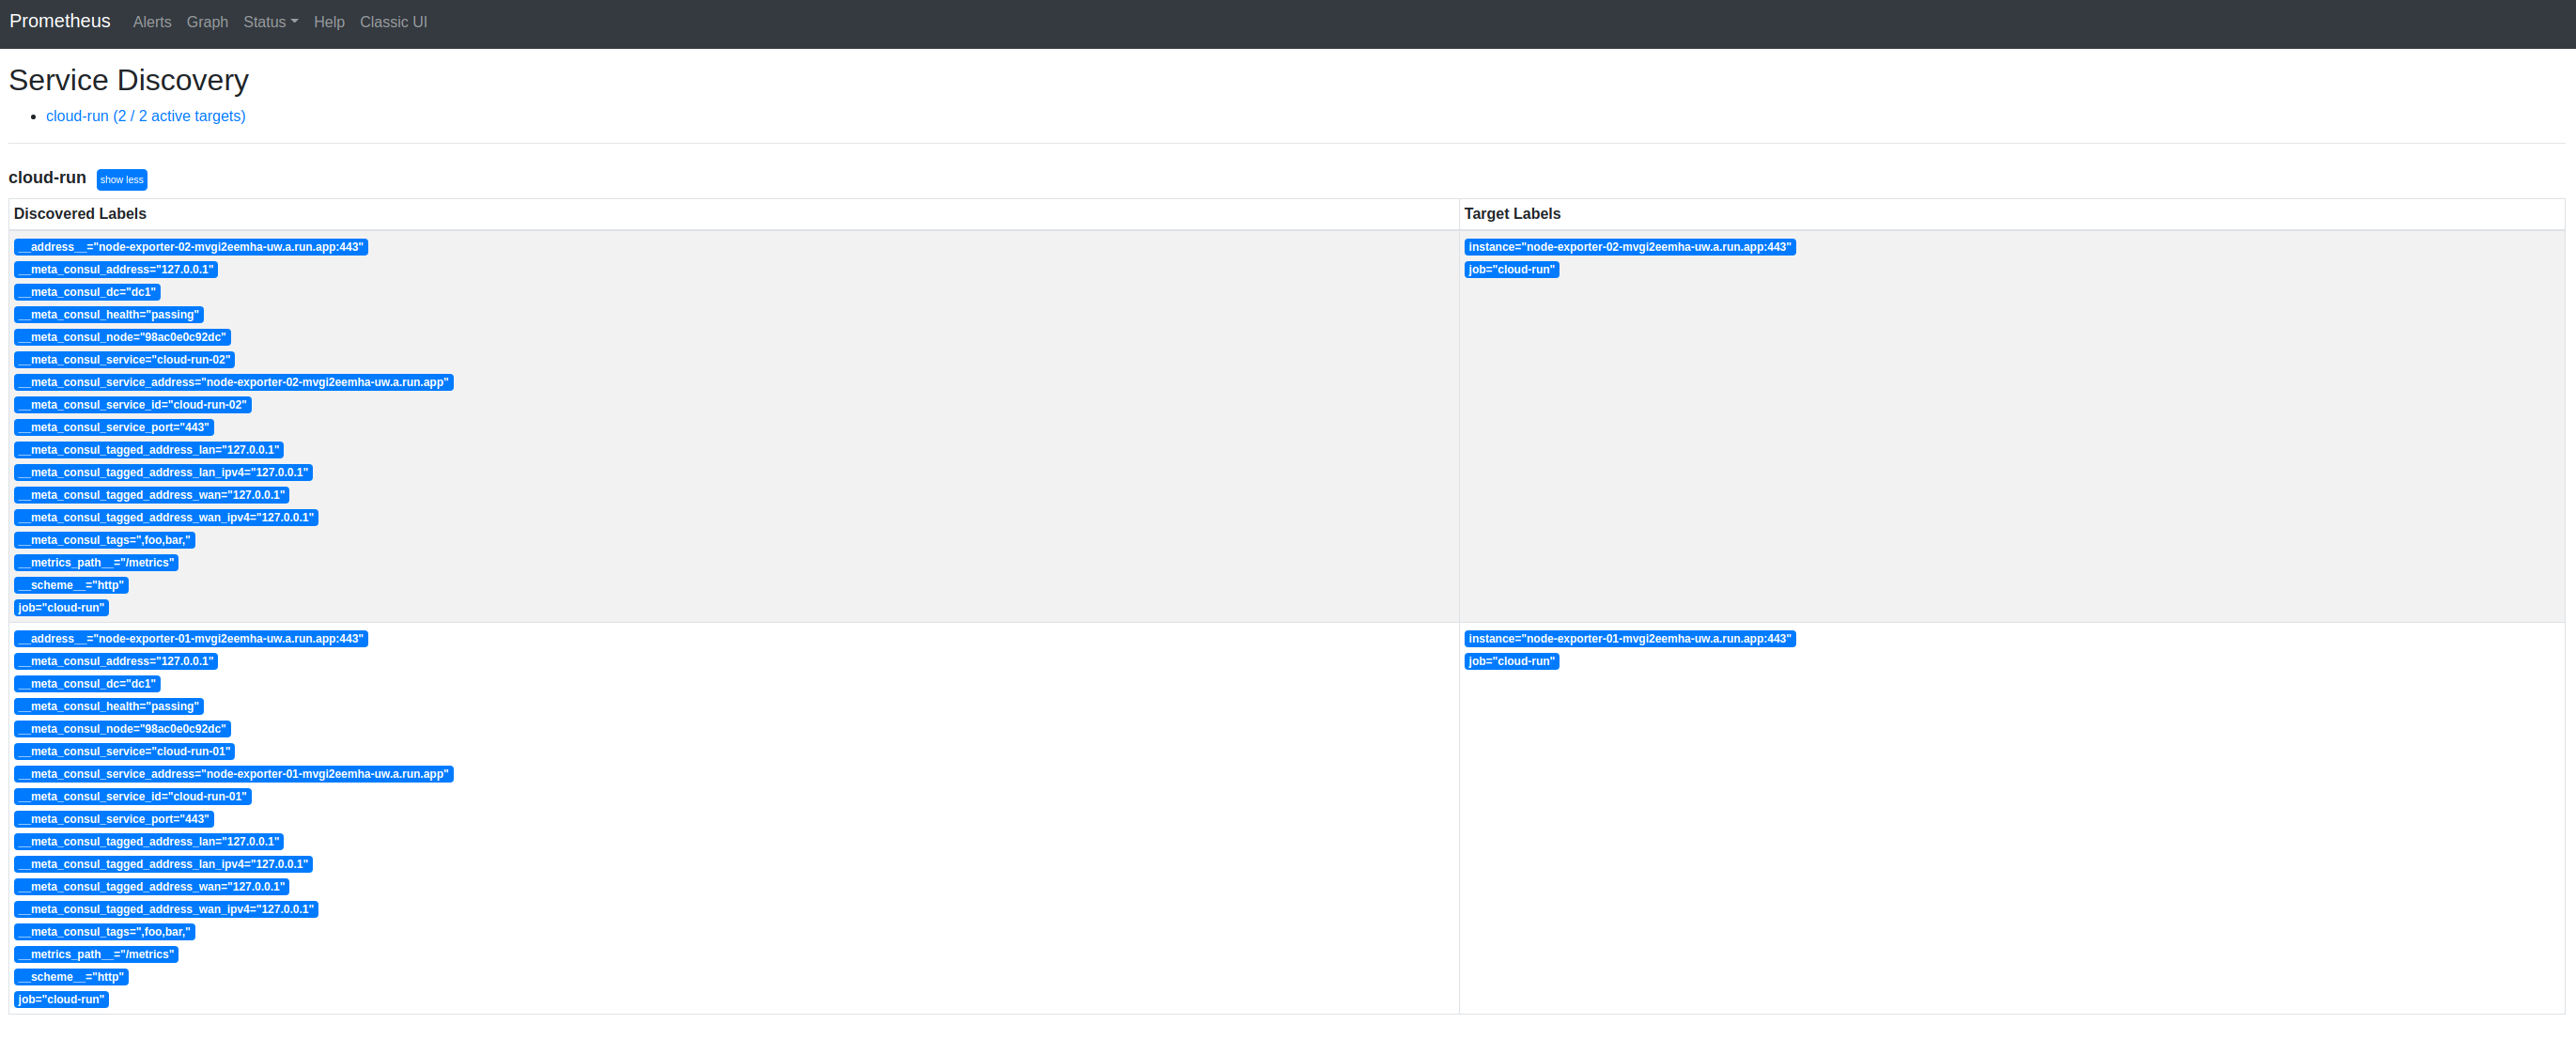
And:

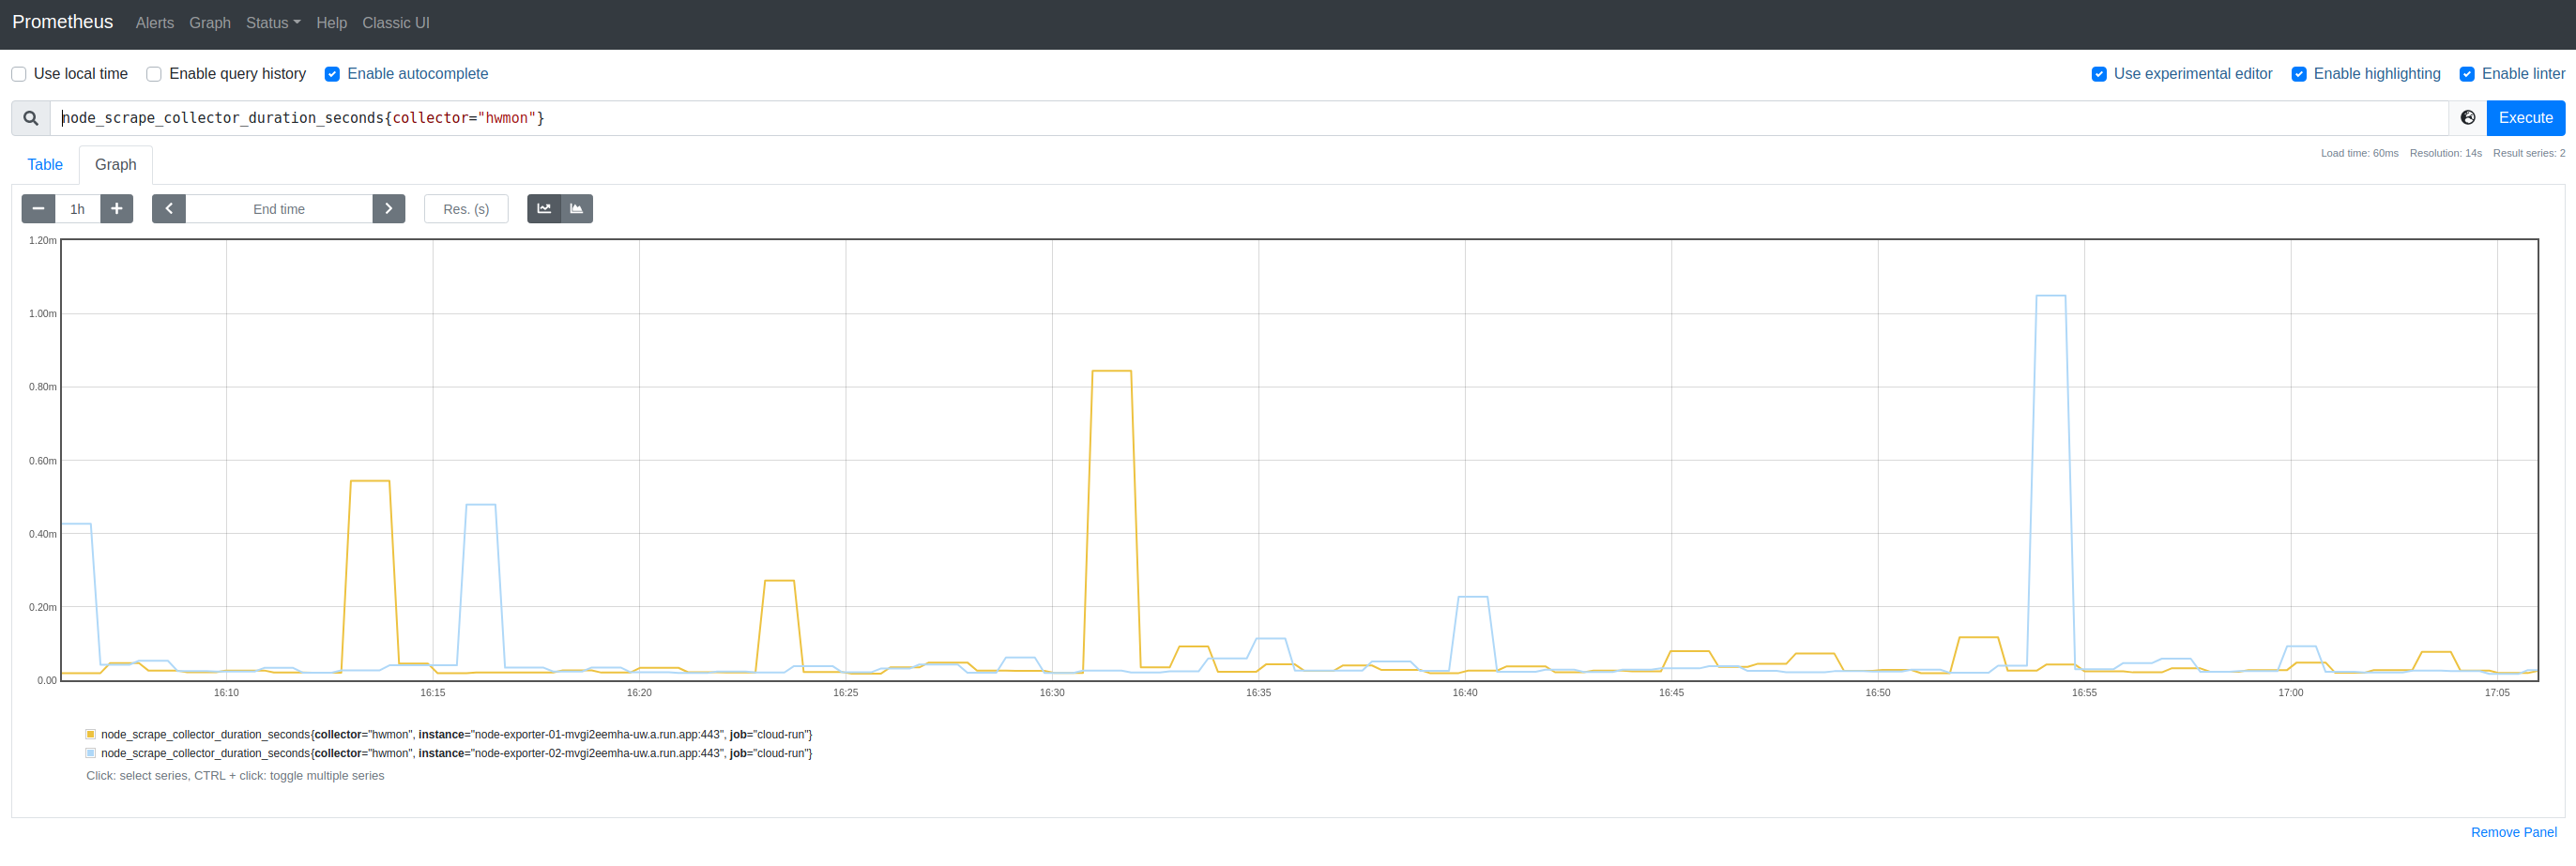
And, although Cloud Run does not furnish Node Exporter with much data, we can (for sake of a random graph), view node_scrape_collector_duration_seconds{collector="hwmon"}:
dig
Consul is also able to respond as a DNS daemon. By reconfiguring docker-compose.yml to expose the default DNS port (8600):
  consul:
    restart: always
    image: consul:1.10.0-beta
    container_name: consul
    expose:
    - "8500" # HTTP API|UI
    - "8600" # DNS
    ports:
    - 8500:8500/tcp
    - 8600:8600/udp
We can, use dig to query our services:
dig @localhost -p8600 cloud-run-01.service.dc1.consul.
Yields:
dig @127.0.0.1 -p 8600 cloud-run-01.service.dc1.consul.

; <<>> DiG 9.16.1-Ubuntu <<>> @127.0.0.1 -p 8600 cloud-run-01.service.dc1.consul.
; (1 server found)
;; global options: +cmd
;; Got answer:
;; ->>HEADER<<- opcode: QUERY, status: NOERROR, id: 58382
;; flags: qr aa rd; QUERY: 1, ANSWER: 1, AUTHORITY: 0, ADDITIONAL: 1
;; WARNING: recursion requested but not available

;; OPT PSEUDOSECTION:
; EDNS: version: 0, flags:; udp: 4096
;; QUESTION SECTION:
;cloud-run-01.service.dc1.consul. IN	A

;; ANSWER SECTION:
cloud-run-01.service.dc1.consul. 0 IN	CNAME	node-exporter-01-mvgi2eemha-uw.a.run.app.

;; Query time: 4 msec
;; SERVER: 127.0.0.1#8600(127.0.0.1)
;; WHEN: Tue Apr 20 10:18:50 PDT 2021
;; MSG SIZE  rcvd: 114
Or by SRV:
dig @127.0.0.1 -p 8600 cloud-run-01.service.dc1.consul. SRV
Yields:
; <<>> DiG 9.16.1-Ubuntu <<>> @127.0.0.1 -p 8600 cloud-run-01.service.dc1.consul. SRV
; (1 server found)
;; global options: +cmd
;; Got answer:
;; ->>HEADER<<- opcode: QUERY, status: NOERROR, id: 11114
;; flags: qr aa rd; QUERY: 1, ANSWER: 1, AUTHORITY: 0, ADDITIONAL: 2
;; WARNING: recursion requested but not available

;; OPT PSEUDOSECTION:
; EDNS: version: 0, flags:; udp: 4096
;; QUESTION SECTION:
;cloud-run-01.service.dc1.consul. IN	SRV

;; ANSWER SECTION:
cloud-run-01.service.dc1.consul. 0 IN	SRV	1 1 443 node-exporter-01-mvgi2eemha-uw.a.run.app.

;; ADDITIONAL SECTION:
9fd04d771d42.node.dc1.consul. 0	IN	TXT	"consul-network-segment="

;; Query time: 0 msec
;; SERVER: 127.0.0.1#8600(127.0.0.1)
;; WHEN: Tue Apr 20 10:24:02 PDT 2021
;; MSG SIZE  rcvd: 174