Prometheus AlertManager
- 3 minutes read - 594 wordsYesterday I discussed a Linode Prometheus Exporter and tantalized use of Prometheus AlertManager.
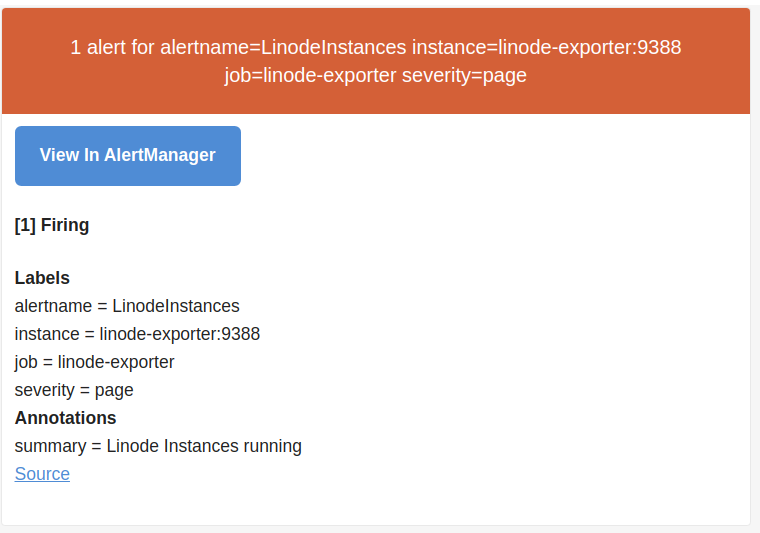
Success:

Configure
The process is straightforward although I found the Prometheus (config) documentation slightly unwieldy to navigate :-(
The overall process is documented.
Here are the steps I took:
Configure Prometheus
Added the following to prometheus.yml:
rule_files:
- "/etc/alertmanager/rules/linode.yml"

alerting:
  alertmanagers:
    - scheme: http
      static_configs:
        - targets:
            - "alertmanager:9093"
Rules must be defined in separate rules files. See below for the content for linode.yml and an explanation.
The alerting section specifies that an AlertManager will be accessible on alertmanager:9093. 9093 is the default port and the alertmanager hostname will come courtesy of Docker Compose.
linode.yaml:
groups:
- name: linode
  rules:
  - alert: LinodeInstances
    expr: linode_instance_count > 0
    for: 60m
    labels:
      severity: page
    annotations:
      summary: Linode Instances running
  - alert: LinodeNodeBalancers
    expr: linode_nodebalancer_count > 0
    for: 60m
    labels:
      severity: page
    annotations:
      summary: Linode NodeBalancers running
The rule defines a group (of alerts) called linode. These will represent the set I’m going to define for my Linode account leveraging the exporter. There are 2 alerts.
- LinodeInstances
- LinodeNodeBalanacers
The magic happens with the expr statements. I’m not familiar with PromQL but e.g. linode_instance_count is the name of a metric exposed by the exporter and this alert will be true when that numbers exceeds 0, i.e. I have at least one instance running. The alert will fire when this holds true for an hour (60 minutes) or more. You can see the pattern here. As more metrics are surfaced by the exporter, e.g. Linode Kubernetes Engine, these can be quickly represented with alerts.
Configure AlertManager
I’m using Docker Compose and already have the Prometheus container image. Unsurprisingly, there’s an image for AlertManager too. As with Prometheus, this expects a configuration YAML. Unoriginally, I called this alertmanager.yaml:
route:
  group_by: ["..."]
  receiver: email-me

receivers:
- name: email-me
  email_configs:
  - to: [[EMAIL-ADDR]]
    from: [[EMAIL-ADDR]]
    smarthost: smtp.gmail.com:587
    auth_username: [[EMAIL-ADDR]]
    auth_identity: [[EMAIL-ADDR]]
    auth_password: [[EMAIL-PASS]]
This is one (of many) possible alert receivers. I’m alerting by having emails sent to my Gmail account. I found this helpful explanation on the excellent Prometheus-centric blog Robust Perception. Replace [[EMAIL-ADDR]] with your Gmail address and [[EMAIL-PASS]] with the app token that you generate.
I’m unfamiliar with the route mechanism but – IIUC – this sents every alerts (["..."]) to email-me.
Revise Docker Compose
Everything is in place and we can now run the comnbined services by adding prom/alertmanager to the mix:
prometheus:
  restart: always
  depends_on:
  - linode-exporter
  image: prom/prometheus:v2.14.0
  container_name: prometheus
  volumes:
  - ${PWD}/prometheus.yml:/etc/prometheus/prometheus.yml
  - ${PWD}/linode.yml:/etc/alertmanager/rules/linode.yml
  expose:
  - "9090"
  ports:
  - 9090:9090

alertmanager:
  restart: always
  depends_on:
  - prometheus
  image: prom/alertmanager:v0.20.0
  container_name: alertmanager
  volumes:
  - ${PWD}/alertmanager.yml:/etc/alertmanager/alertmanager.yml
  expose:
  - "9093"
  ports:
  - 9093:9093
NB Because we added a rules file to prometheus.yml, we must revise the volumes reference for the prometheus service
NB 9093 is the default AlertManager port for receiving alerts (from Prometheus) and for presenting the UI
Run
All being well, docker-compose up then docker-compose ps should get us:
     Name                    Command                  State               Ports
----------------------------------------------------------------------------------------
alertmanager      /bin/alertmanager --config ...   Up             0.0.0.0:9093->9093/tcp
cadvisor          /usr/bin/cadvisor -logtostderr   Up (healthy)   0.0.0.0:8085->8080/tcp
linode-exporter   /linode-exporter --linode_ ...   Up             0.0.0.0:9388->9388/tcp
prometheus        /bin/prometheus --config.f ...   Up             0.0.0.0:9090->9090/tcp
You can browse:
- AlertManager on
http://localhost:9093 - Prometheus on
http://localhost:9090 - cAdvisor on
http://localhost:8085
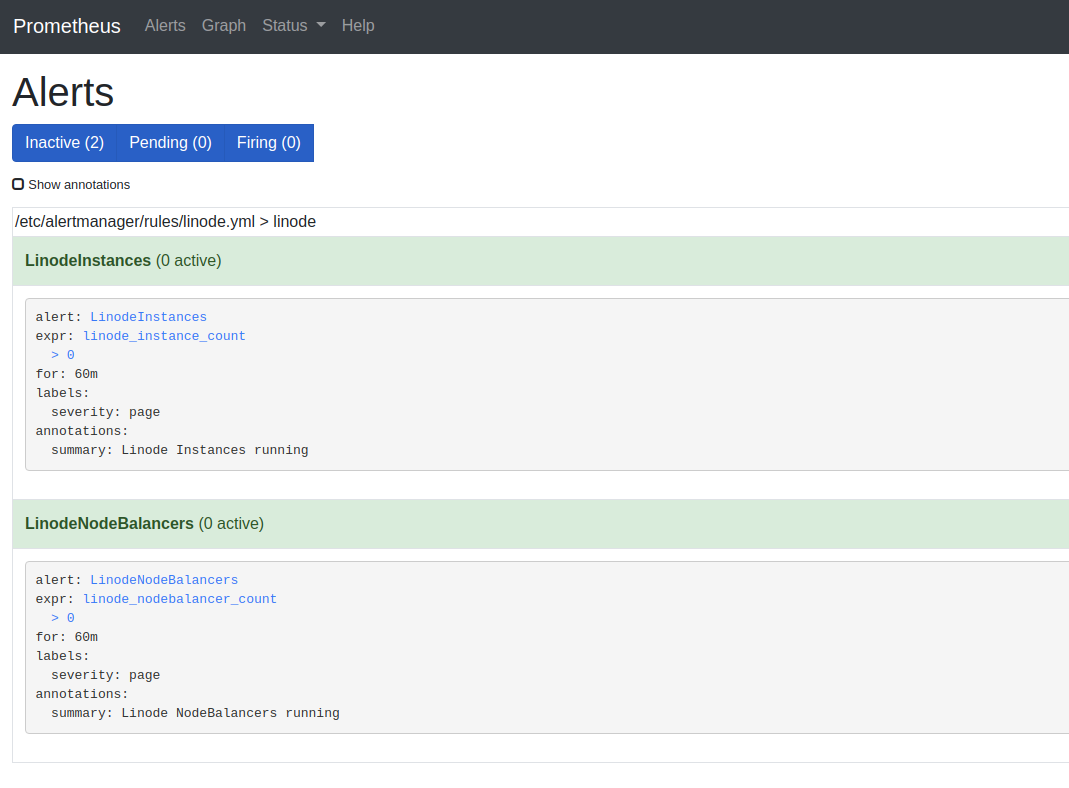
Under Prometheus, you ought now be able to see a list of alerts:

NB Because I’ve no active instances and nodebalancers (yet), these are “inactive”
Then, after creating a Linode Kubernetes Engine cluster:

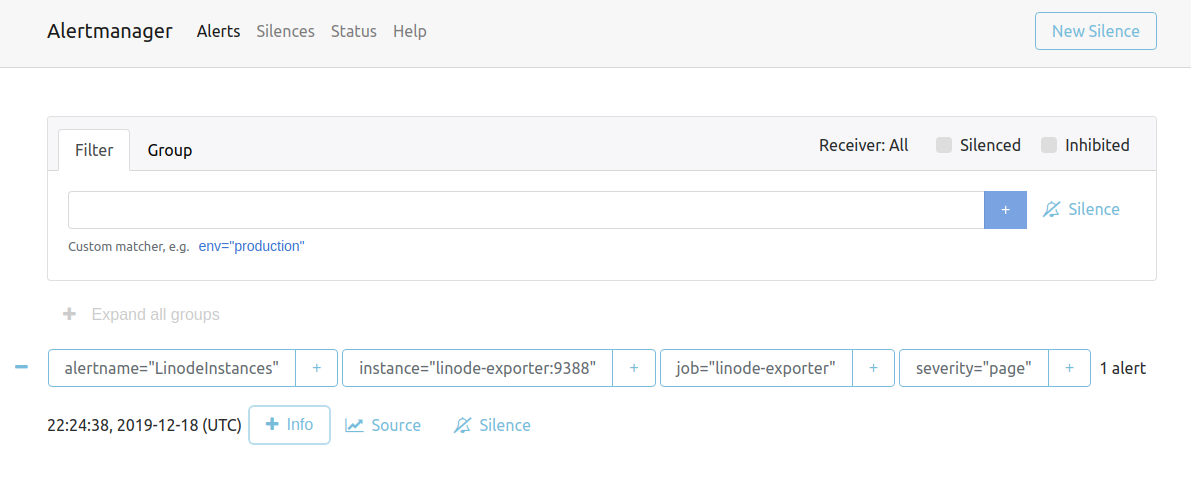
And then, after an hour:

And:

And, this triggers an email of the type that is shown at the top of this post. Neat!