Below you will find pages that utilize the taxonomy term “Exporter”
Prometheus Exporter documentation
I have a new router that runs OpenWRT and it provides a Prometheus (Node) Exporter (written in Lua)
NOTE The
prometheus-node-exporter-luaExporter package is a 4KB (!) script
As I’m sure is a common experience for others, it’s great that there’s an Exporter and a wealth of metrics exposed by it. One problem is that there’s no guidance on how to use these metrics to construct useful PromQL queries and Alertmanager alerts.
I think it would be useful for Exporters to publish a Documentation endpoints (perhaps /docs to go along with /metrics) that would include such guidance.
Prometheus Exporter for USGS Water Data service
I’m a little obsessed with creating Prometheus Exporters:
- Prometheus Exporter for Azure
- Prometheus Exporter for crt.sh
- Prometheus Exporter for Fly.io
- Prometheus Exporter for GoatCounter
- Prometheus Exporter for Google Cloud
- Prometheus Exporter for Koyeb
- Prometheus Exporter for Linode
- Prometheus Exporter for PorkBun
- Prometheus Exporter for updown.io
- Prometheus Exporter for Vultr
All of these were written to scratch an itch.
In the case of the cloud platform exporters (Azure, Fly, Google, Linode, Vultr etc.), it’s an overriding anxiety that I’ll leave resources deployed on these platforms and, running an exporter that ships alerts to Pushover and Gmail, provides me a support mechanism for me.
Prometheus Exporter for Koyeb
Yet another cloud platform exporter for resource|cost management. This time for Koyeb with Koyeb Exporter.
Deploying resources to cloud platforms generally incurs cost based on the number of resources deployed, the time each resource is deployed and the cost (per period of time) that the resource is deployed. It is useful to be able to automatically measure and alert on all the resources deployed on all the platforms that you’re using and this is an intent of these exporters.
Prometheus Exporter for Azure (Container Apps)
I’ve written Prometheus Exporters for various cloud platforms. My motivation for writing these Exporters is that I want a unified mechanism to track my usage of these platform’s services. It’s easy to deploy a service on a platform and inadvertently leave it running (up a bill). The set of exporters is:
- Prometheus Exporter for Azure
- Prometheus Exporter for Fly.io
- Prometheus Exporter for GCP
- Prometheus Exporter for Linode
- Prometheus Exporter for Vultr
This post describes the recently-added Azure Exporter which only provides metrics for Container Apps and Resource Groups.
Prometheus Exporters for fly.io and Vultr
I’ve been on a roll building utilities this week. I developed a Service Health dashboard for my “thing”, a Prometheus Exporter for Fly.io and today, a Prometheus Exporter for Vultr. This is motivated by the fear that I will forget a deployed Cloud resource and incur a horrible bill.
I’ve no written several Prometheus Exporters for cloud platforms:
- Prometheus Exporter for GCP
- Prometheus Exporter for Linode
- Prometheus Exporter for Fly.io
- Prometheus Exporter for Vultr
Each of them monitors resource deployments and produces resource count metrics that can be scraped by Prometheus and alerted with Alertmanager. I have Alertmanager configured to send notifications to Pushover. Last week I wrote an integration between Google Cloud Monitoring to send notifications to Pushover too.
Google Home Exporter
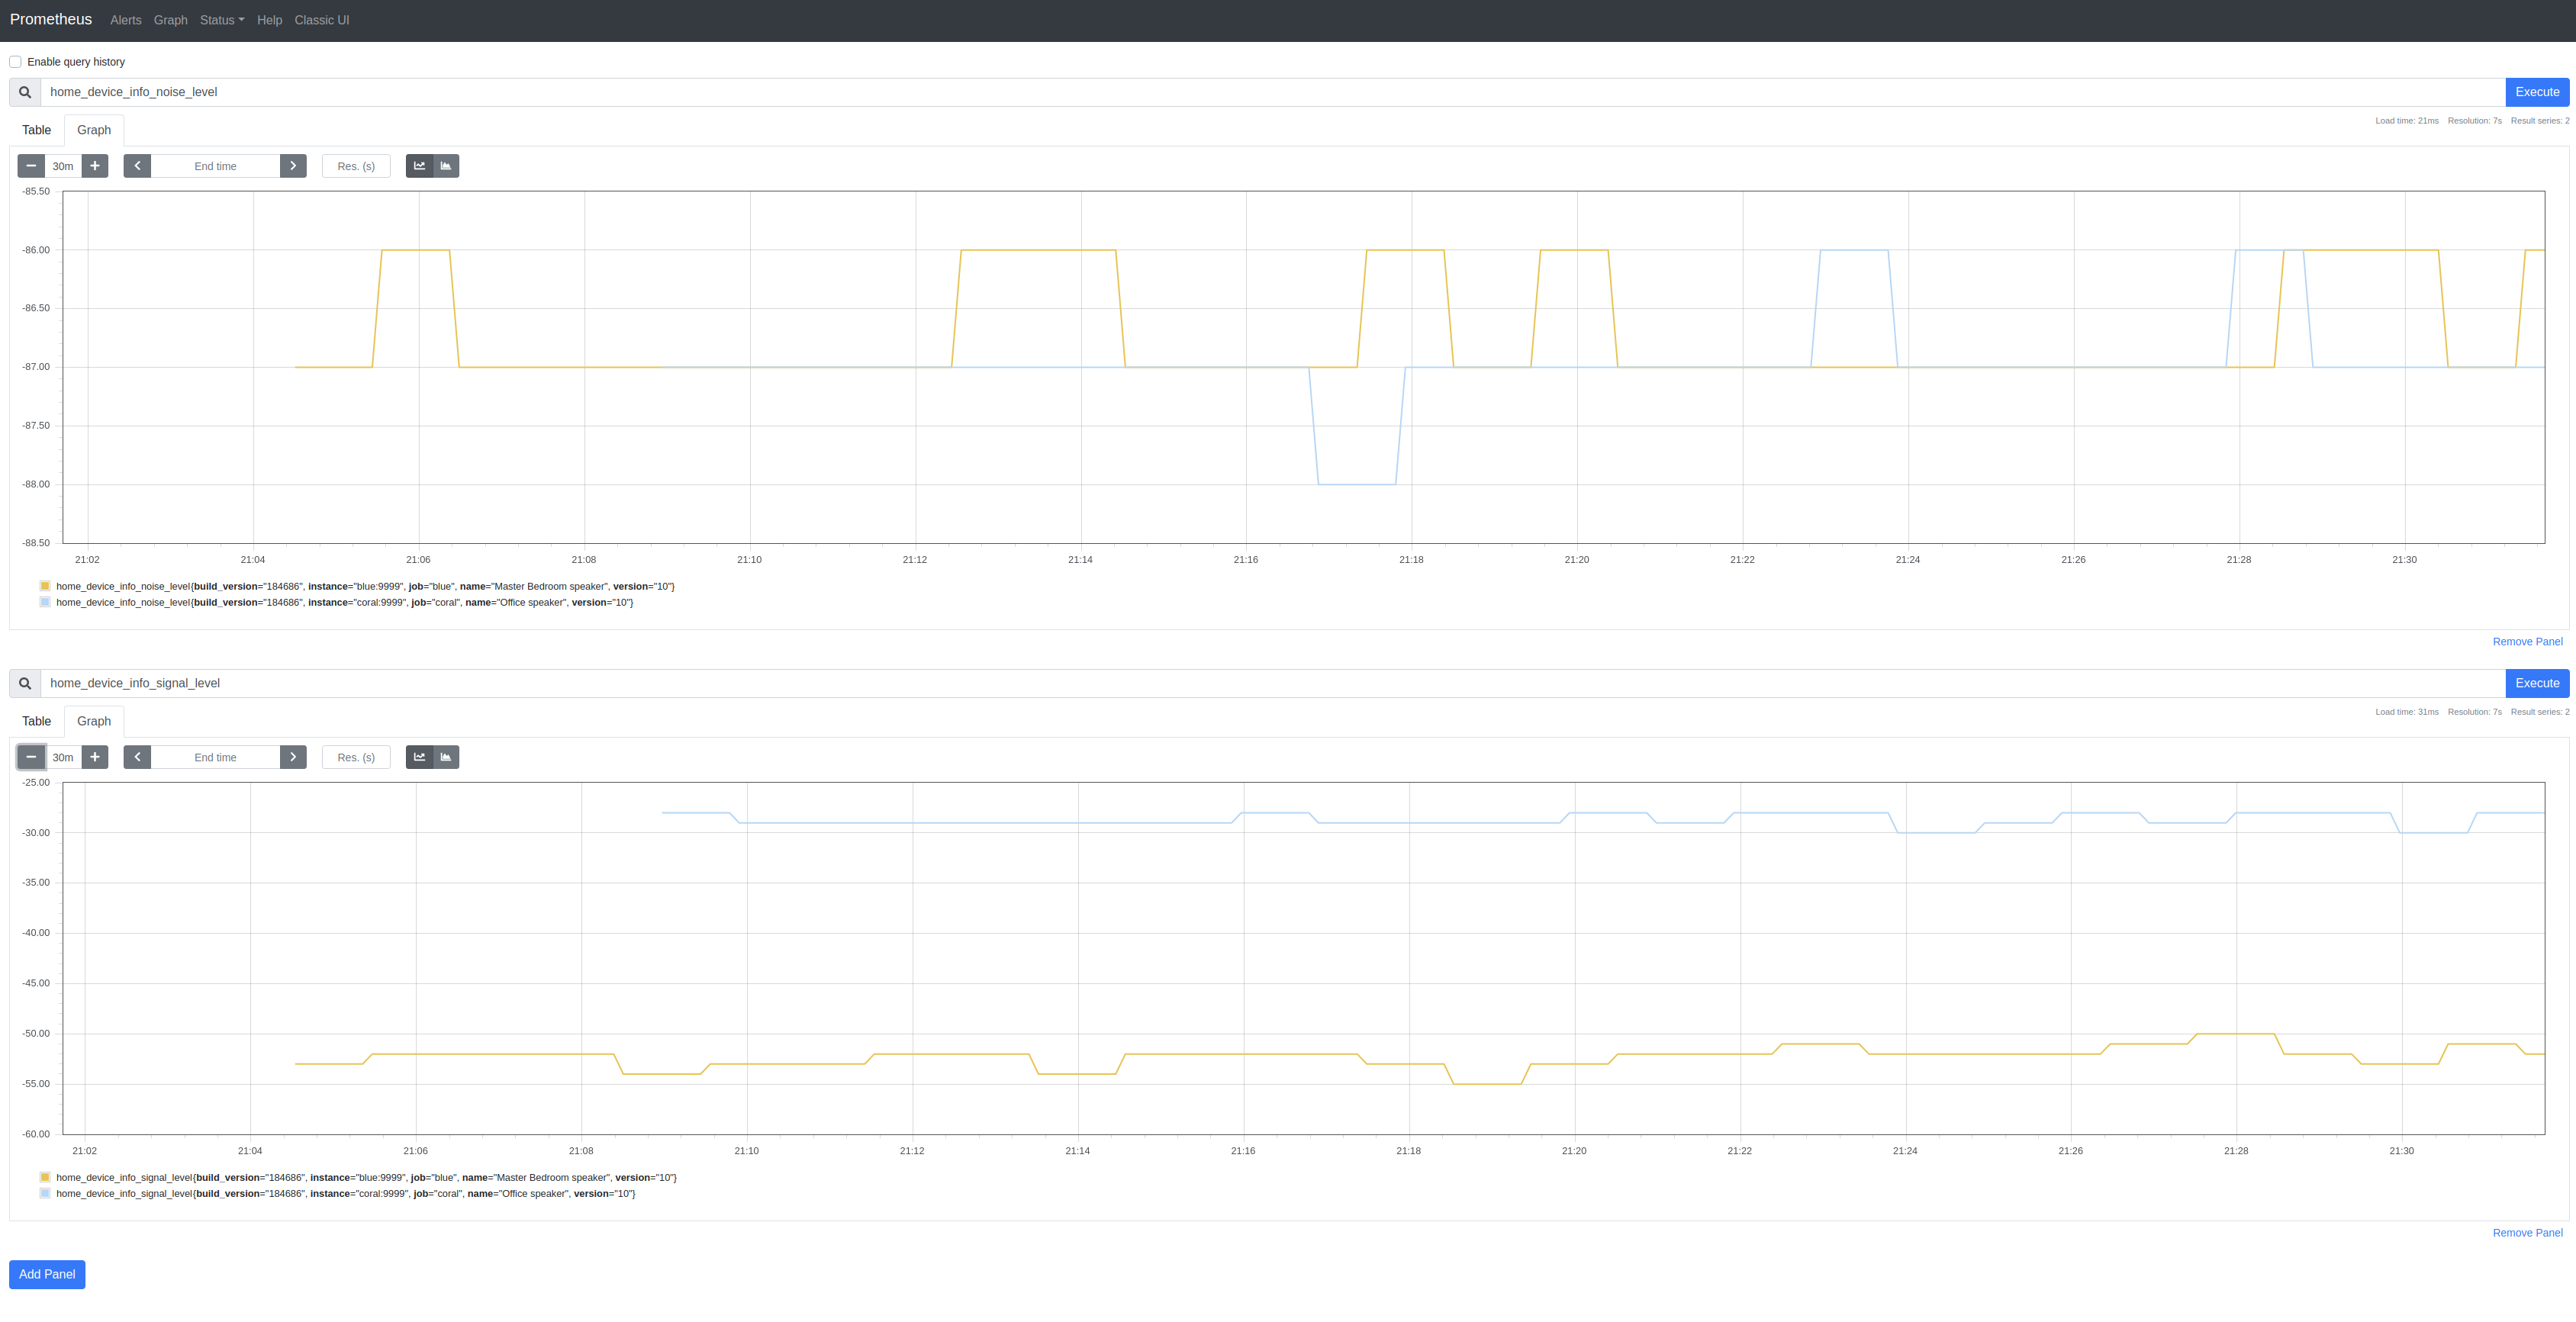
I’m obsessing over Prometheus exporters. First came Linode Exporter, then GCP Exporter and, on Sunday, I stumbled upon a reverse-engineered API for Google Home devices and so wrote a very basic Google Home SDK and a similarly basic Google Home Exporter:

The SDK only implements /setup/eureka_info and then only some of the returned properties. There’s not a lot of metric-like data to use besides SignalLevel (signal_level) and NoiseLevel (noise_level). I’m not clear on the meaning of some of the properties.
Google Cloud Platform (GCP) Exporter
Earlier this week I discussed a Linode Prometheus Exporter.
I added metrics for Digital Ocean’s Managed Kubernetes service to @metalmatze’s Digital Ocean Exporter.
This left, metrics for Google Cloud Platform (GCP) which has, for many years, been my primary cloud platform. So, today I wrote Prometheus Exporter for Google Cloud Platform.
All 3 of these exporters follow the template laid down by @metalmatze and, because each of these services has a well-written Golang SDK, it’s straightforward to implement an exporter for each of them.
Linode Prometheus Exporter
I enjoy using Prometheus and have toyed around with it for some time particularly in combination with Kubernetes. I signed up with Linode [referral] compelled by the addition of a managed Kubernetes service called Linode Kubernetes Engine (LKE). I have an anxiety that I’ll inadvertently leave resources running (unused) on a cloud platform. Instead of refreshing the relevant billing page, it struck me that Prometheus may (not yet proven) help.
The hypothesis is that a combination of a cloud-specific Prometheus exporter reporting aggregate uses of e.g. Linodes (instances), NodeBalancers, Kubernetes clusters etc., could form the basis of an alert mechanism using Prometheus’ alerting.