ESPHome, MQTT, Prometheus and almost Cloud IoT
- 9 minutes read - 1806 wordsESPHome is a very interesting project. I’d not heard of it until this week and am surprised that it isn’t more newsworthy.
I’m always tinkering with IoT stuff, have a couple of Wemos D1 ESP8266s. They are brought out occasionally for learning. I’ve been using them this week with ESPHome. I’m looking to buy some Xiaomi BLE temperature sensors and thinking I could read the temperatures from these using the ESPs (thanks to ESPHome) and publish the data to MQTT. I tried (unsuccessfully) to publish to Google Cloud IoT (not Google’s fault but a limitation in the current ESPHome, I think) but have been successful publishing to a Mosquitto broker and rendering the metric data in Prometheus.
Aside: I recently received a couple of Longan Nano RISC-Vs; I’ll hope to blog about them soon too
Develop
ESPHome
Install:
WORK=[[YOUR-PROJECT-DIR]]
cd ${WORK}
python3 -m venv venv
source venv/bin/activate
pip install esphome
pip install platformio
I learned it’s best to run the initial deployment with the ESPs plugged in to a USB port. Once an ESPHome binary is deployed to the device, you can use over-the-air (OTA) for subsequent deployments.
Sensors
Absent any actual sensors and wanting to get started, I pinged the ESPHome GitHub repo for guidance on a test (random number) generating sensor. There isn’t one in the ‘package’ but it’s trivial to write one. gimnet kindly provided code for “Template Sensor” (see below) too.
Here’s my random number (0..100) generator that updates every 60 seconds:
sensor:
  - platform: template
    name: "Random Numbers"
    id: random_sensor
    unit_of_measurement: "%"
    lambda: |-
      return rand() % 100;
    update_interval: 60s
Here’s gimnet’s “Template Sensor” that I renamed to “Counter Sensor”:
sensor:
- platform: template
    name: "Counter Sensor"
    id: counter_sensor

interval:
  - interval: 60s
    then:
      lambda: |-
        static int value1 = 0;
        id(counter_sensor).publish_state(value1++);
MQTT
I’ll describe below my work on attempting to communicate with Google Cloud Platform’s MQTT service that’s part of Cloud IoT. As I mentioned, I believe (!) it’s not currently possible to publish to a TLS-based MQTT broker. I may be wrong. I’ll document what I did below.
Absent that, I decided to create a local MQTT broker and Eclipse’s Mosquitto is the exemplar implementation.
I’m going to bundle MQTT, a gateway (!), Prometheus and cAdvisor in a Docker Compose file. Here’s the service entry for Mosquitto:
services:
  mqtt:
    container_name: mqtt
    image: eclipse-mosquitto:1.6.8
    # volumes:
    #   - ${DIR}/mosquitto.conf:/mosquitto/config/mosquitto.conf
    expose:
      - "1883"
      - "9001"
    ports:
      - 1883:1883
      - 9001:9001
NB If you wish to tweak the Mosquitto broker config, uncomment the volumes and define a mosquitto.conf file
I’m exposing 1883 because we’ll be accessing the broker from remote ESPs.
Assuming, I have a broker running on ${IP} and ${PORT} (default: 1883), here’s the ESPHome config. This is all well-documented MQTT Client Component
mqtt:
  broker: ${IP}
  port: ${PORT}
MQTT Gateway
Inuits has a Golang-based MQTT Gateway for Prometheus.
See: https://github.com/inuits/mqttgateway
This is analogous to the Prometheus Push Gateway. It listens to MQTT topics and renders MQTT message (values) as Prometheus metrics (using Prometheus’ exposition format).
For example, if we use the Mosquitto (container image) mosquitto_pub client to publish a message (42) to MQTT topic prometheus/job/test/instance/test/test:
docker run \
--interactive --tty \
--net=host \
eclipse-mosquitto:1.6.8 mosquitto_pub \
  -h localhost \
  -p 1883 \
  -m 42 \
  -t prometheus/job/test/instance/test/test
And then curl the MQTT Gateway’s metrics endpoint:
curl -s http://localhost:9337/metrics | grep test
You can see 3 metrics are generated: mqtt_test_last_pushed_timestamp, mqtt_test_push_total and test
test matches prometheus/job/test/instance/test/test while the other 2 metrics are derived from it.
test is labeled instance="test" and job="test" which are derived from the MQTT topic path.
Very cool!!
# HELP mqtt_test_last_pushed_timestamp Last time test was pushed via MQTT
# TYPE mqtt_test_last_pushed_timestamp gauge
mqtt_test_last_pushed_timestamp{instance="test",job="test"} 1.5828373496970892e+09
# HELP mqtt_test_push_total Number of times test was pushed via MQTT
# TYPE mqtt_test_push_total counter
mqtt_test_push_total{instance="test",job="test"} 3
# HELP test Metric pushed via MQTT
# TYPE test gauge
test{instance="test",job="test"} 42
We can manifest this in the ESPHome configuration as:
interval:
  - interval: 60s
    then:
      - mqtt.publish:
          topic: prometheus/job/esphome/node/esp01/temperature
          payload: !lambda |-
            return esphome::to_string(rand() % 100);
Every 60 seconds, it publishes a random number (as a string) to the topic prometheus/job/esphome/node/esp01/temperature
The GitHub repo does not appear to provide a Docker container image for the code. I tweaked it slightly, migrated the code to Go Modules and then published it as:
https://hub.docker.com/repository/docker/dazwilkin/mqttgateway
I did this so as to be able to combine the gateway into the Docker Compose file. Here’s its service:
services:
  mqttgateway:
    depends_on:
      - mqtt
    container_name: mqttgateway
    image: dazwilkin/mqttgateway:8938c69bfb9150da432fe7af1a7fe2cfaaa84ded
    command:
      #- --web.listen-address=:9337
      #- --web.telemetry-path=/metrics
      - --mqtt.broker-address=tcp://mqtt:1883
      #- --mqtt.topic=prometheus/#
      #- --mqtt.prefix=prometheus
      # - --mqtt.username=
      # - --mqtt.password=
      # - --mqtt.clientid=
    expose:
      - "9337"
    ports:
      - 9337:9337
NB I’ve left the flags in place if you wish to change these but, I’m using defaults for everyting except the broker’s address.
The broker’s address corresponds to the Compose service name for the broker, i.e. mqtt.
Prometheus | cAdvisor
The Prometheus configuration is straightforward. It scrapes the MQTT Gateway on mqttgateway:9337 and /metrics, itself (the Prometheus server) and cAdvisor:
services:
  prometheus:
    restart: always
    depends_on:
      - mqttgateway
    image: prom/prometheus:v2.16.0-rc.0
    container_name: prometheus
    volumes:
      - "${PWD}/prometheus.yml:/etc/prometheus/prometheus.yml"
    expose:
      - "9090" # Default HTTP Endpoint
    ports:
      - 9090:9090

  cadvisor:
    restart: always
    image: google/cadvisor:v0.33.0
    container_name: cadvisor
    # command:
    # - --prometheus_endpoint="/metrics"
    volumes:
      - "/:/rootfs:ro"
      - "/var/run:/var/run:rw"
      - "/sys:/sys:ro"
      - "/var/lib/docker/:/var/lib/docker:ro"
    expose:
      - "8080"
    ports:
      - 8085:8080
Run
ESPHome Dashboard|Logs
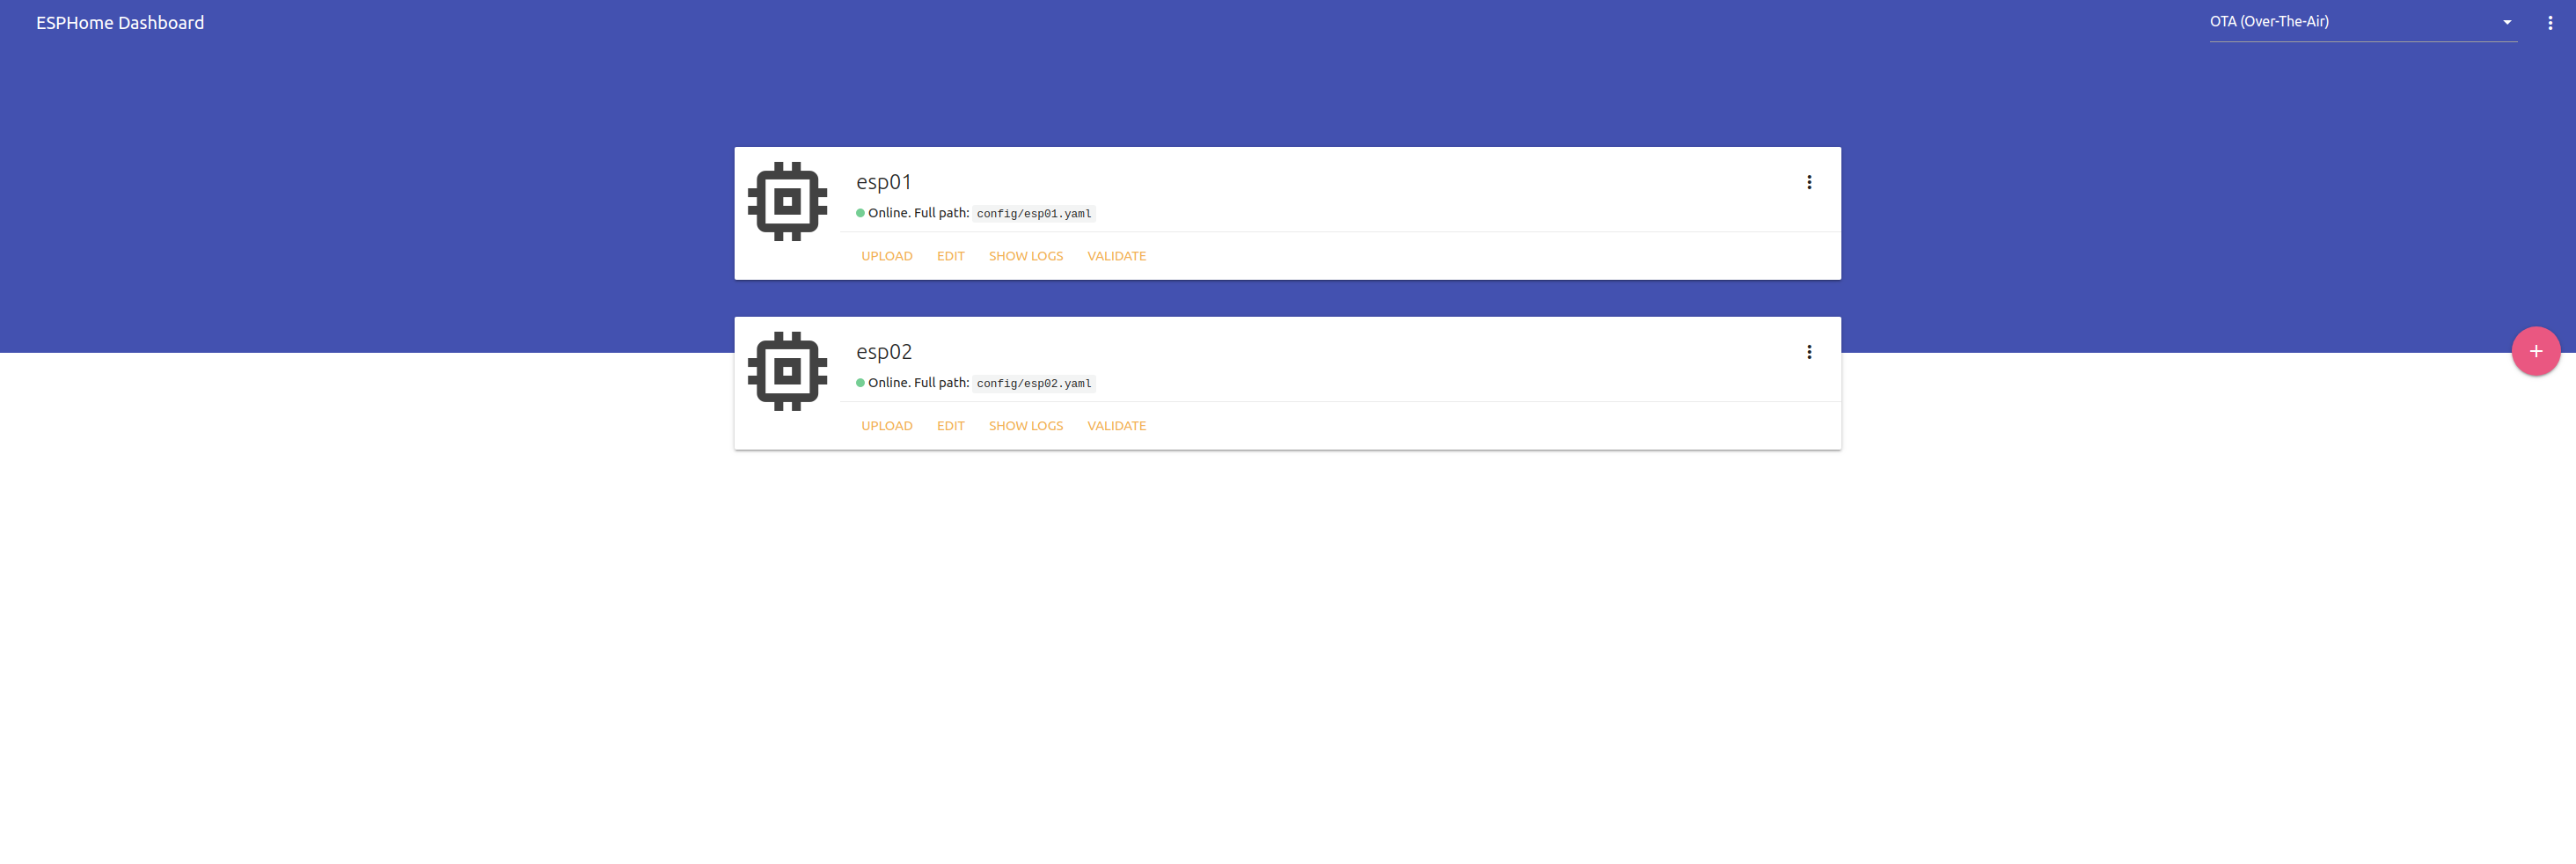
Once you’ve deployed ESPHome code to an ESP, you may monitor device(s), using the Dashboard. Here are my (imaginatively) named devices:

You can view logs using the dashboard, or the command-line:
esphome config/esp01.yaml logs

INFO Reading configuration config/esp01.yaml...
INFO Starting log output from 192.168.1.201 using esphome API
INFO Connecting to 192.168.1.201:6053 (192.168.1.201)
INFO Successfully connected to 192.168.1.201
[13:50:36][I][app:100]: ESPHome version 1.14.3 compiled on Feb 27 2020, 13:06:02
[13:50:36][C][wifi:415]: WiFi:
[13:50:36][C][wifi:283]:   SSID: '[[REDACTED]]'
[13:50:36][C][wifi:284]:   IP Address: 192.168.1.201
[13:50:36][C][wifi:286]:   BSSID: [[REDACTED]]
[13:50:36][C][wifi:287]:   Hostname: 'esp01'
[13:50:36][C][wifi:291]:   Signal strength: -50 dB ▂▄▆█
[13:50:36][C][wifi:295]:   Channel: 5
[13:50:36][C][wifi:296]:   Subnet: 255.255.255.0
[13:50:36][C][wifi:297]:   Gateway: 192.168.1.1
[13:50:36][C][wifi:298]:   DNS1: (IP unset)
[13:50:36][C][wifi:299]:   DNS2: (IP unset)
[13:50:36][C][template.sensor:021]: Template Sensor 'Random Numbers'
[13:50:36][C][template.sensor:021]:   Unit of Measurement: '%'
[13:50:36][C][template.sensor:021]:   Accuracy Decimals: 1
[13:50:36][C][template.sensor:022]:   Update Interval: 60.0s
[13:50:36][C][template.sensor:021]: Template Sensor 'Counter Sensor'
[13:50:36][C][template.sensor:021]:   Unit of Measurement: ''
[13:50:36][C][template.sensor:021]:   Accuracy Decimals: 1
[13:50:36][C][template.sensor:022]:   Update Interval: 60.0s
[13:50:36][C][logger:175]: Logger:
[13:50:36][C][logger:176]:   Level: DEBUG
[13:50:36][C][logger:177]:   Log Baud Rate: 115200
[13:50:36][C][logger:178]:   Hardware UART: UART0
[13:50:36][C][captive_portal:169]: Captive Portal:
[13:50:36][C][ota:029]: Over-The-Air Updates:
[13:50:36][C][ota:030]:   Address: 192.168.1.201:8266
[13:50:36][C][api:095]: API Server:
[13:50:36][C][api:096]:   Address: 192.168.1.201:6053
[13:50:36][C][mqtt:051]: MQTT:
[13:50:36][C][mqtt:053]:   Server Address: 192.168.1.186:1883 (192.168.1.186)
[13:50:36][C][mqtt:054]:   Username: ''
[13:50:36][C][mqtt:055]:   Client ID: 'esp01-600194029b3e'
[13:50:36][C][mqtt:057]:   Discovery prefix: 'homeassistant'
[13:50:36][C][mqtt:058]:   Discovery retain: YES
[13:50:36][C][mqtt:060]:   Topic Prefix: 'esp01'
[13:50:36][C][mqtt:062]:   Log Topic: 'esp01/debug'
[13:50:36][C][mqtt.sensor:024]: MQTT Sensor 'Random Numbers':
[13:50:36][C][mqtt.sensor:028]:   State Topic: 'esp01/sensor/random_numbers/state'
[13:50:36][C][mqtt.sensor:024]: MQTT Sensor 'Counter Sensor':
[13:50:36][C][mqtt.sensor:028]:   State Topic: 'esp01/sensor/counter_sensor/state'
[13:50:49][D][sensor:092]: 'Counter Sensor': Sending state 15.00000  with 1 decimals of accuracy
[13:51:10][D][sensor:092]: 'Random Numbers': Sending state 30.00000 % with 1 decimals of accuracy
[13:51:49][D][sensor:092]: 'Counter Sensor': Sending state 16.00000  with 1 decimals of accuracy
[13:52:10][D][sensor:092]: 'Random Numbers': Sending state 66.00000 % with 1 decimals of accuracy
[13:52:49][D][sensor:092]: 'Counter Sensor': Sending state 17.00000  with 1 decimals of accuracy
[13:53:10][D][sensor:092]: 'Random Numbers': Sending state 69.00000 % with 1 decimals of accuracy
[13:53:49][D][sensor:092]: 'Counter Sensor': Sending state 18.00000  with 1 decimals of accuracy
[13:54:10][D][sensor:092]: 'Random Numbers': Sending state 32.00000 % with 1 decimals of accuracy
[13:54:49][D][sensor:092]: 'Counter Sensor': Sending state 19.00000  with 1 decimals of accuracy
[13:55:10][D][sensor:092]: 'Random Numbers': Sending state 17.00000 % with 1 decimals of accuracy
MQTT Gateway
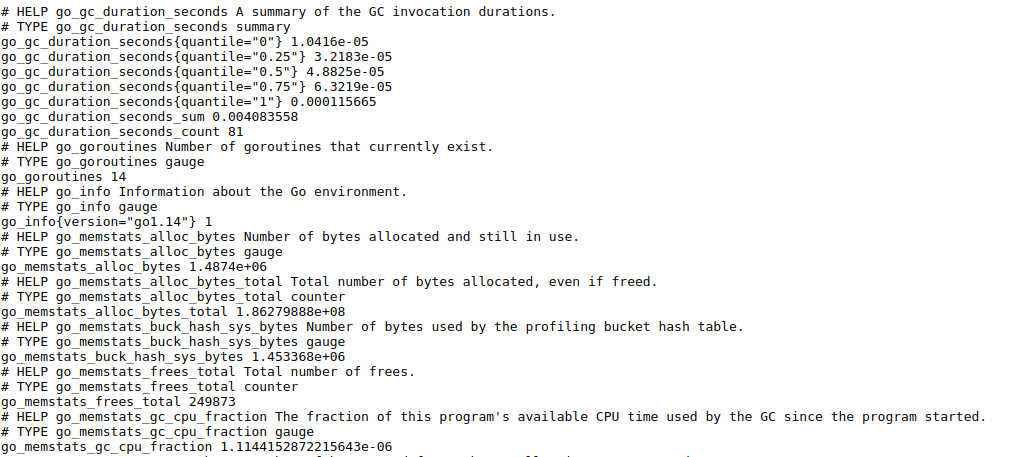
You may browse the metrics that are being published by the MQTT Gateway, via http://localhost:9337/metrics
NB The Compose file publishes the mqttgateway port 9337 (as same) on the host.

That includes many metrics. As you saw before, you can curl the endpoint and grep what you’re interested in too:
curl -s http://localhost:9337/metrics | grep temperature

# HELP mqtt_temperature_last_pushed_timestamp Last time temperature was pushed via MQTT
# TYPE mqtt_temperature_last_pushed_timestamp gauge
mqtt_temperature_last_pushed_timestamp{job="esphome",node="esp01"} 1.582849572454579e+09
mqtt_temperature_last_pushed_timestamp{job="esphome",node="esp02"} 1.5828495536682808e+09
# HELP mqtt_temperature_push_total Number of times temperature was pushed via MQTT
# TYPE mqtt_temperature_push_total counter
mqtt_temperature_push_total{job="esphome",node="esp01"} 198
mqtt_temperature_push_total{job="esphome",node="esp02"} 144
# HELP temperature Metric pushed via MQTT
# TYPE temperature gauge
temperature{job="esphome",node="esp01"} 42
temperature{job="esphome",node="esp02"} 77
NB I’ve configured MQTT clients on both ESPs (esp01,esp02)
Prometheus
You may browse the Prometheus UI, via http://localhost:9090
Confirm the targets:

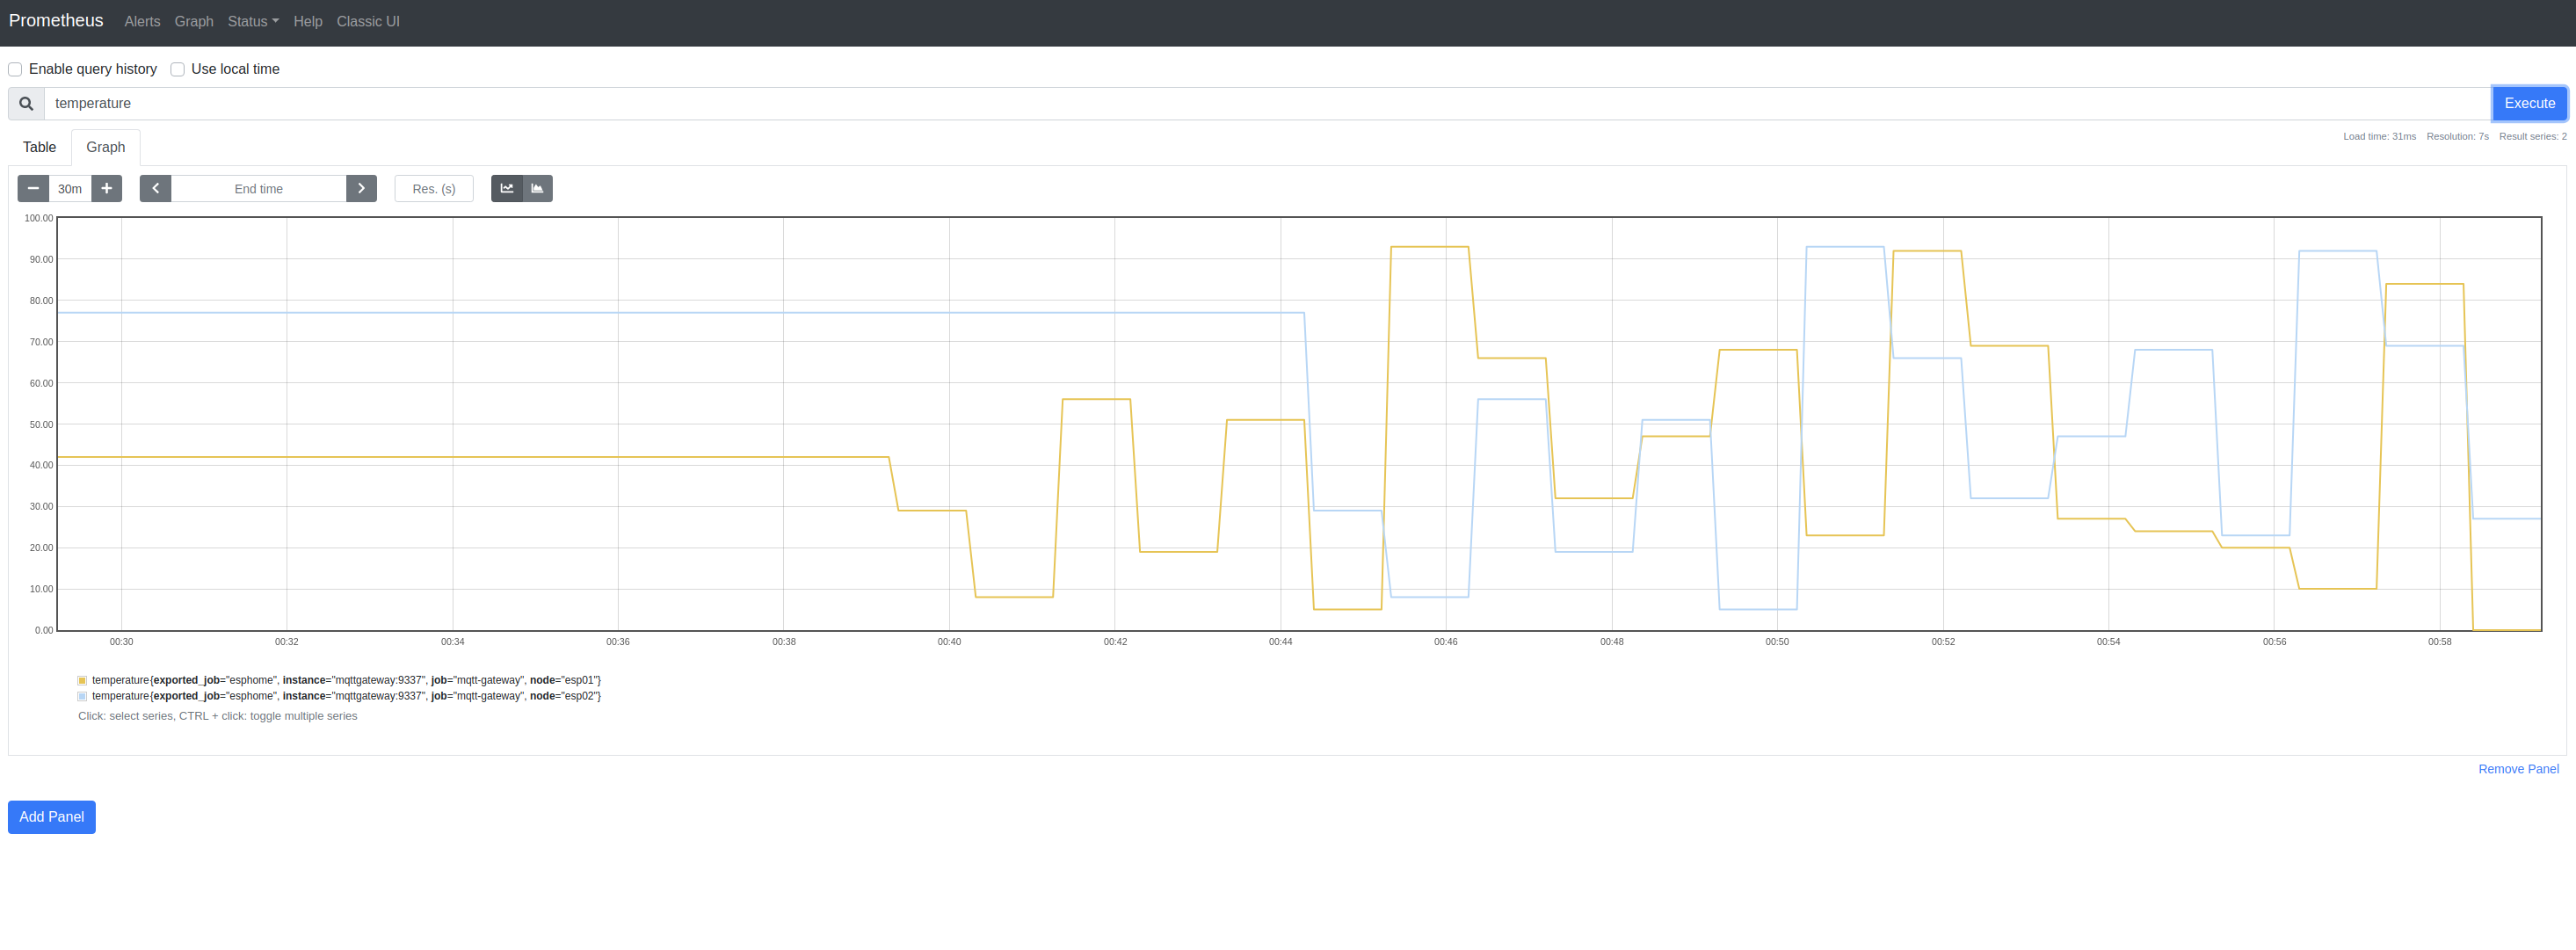
And Graph the temperature metric:

NB I swapped from constant to random values partway through the time period shown above
Google Cloud IoT
It should (!) be possible to publish MQTT messages to Google’s hosted MQTT broker part of the Cloud IoT service.
This didn’t work
I think the issue is with using TLS from the ESPHome MQTT client; I’ll update when I learn more
Here’s a script that creates a GCP Project, enables IoT and Pub/Sub, creates IoT registry, devices, keys and Pub/Sub topics:
# Environment
PROJECT=
REGION=us-central1
REGISTRY=esphome
EVENT_TOPIC=temperature
STATE_TOPIC=state

# Project|Billing
gcloud projects create ${PROJECT}
gcloud alpha billing projects link ${PROJECT} \
--billing-account=${BILLING}

# GCP Services
for SERVICE in "cloudiot" "pubsub"
do
  gcloud services enable ${SERVICE}.googleapis.com \
  --project=${PROJECT} \
  --async
done

# Cloud IoT Registry
gcloud iot registries create ${REGISTRY} \
--region=${REGION} \
--event-notification-config=topic=${EVENT_TOPIC} \
--state-pubsub-topic=${STATE_TOPIC} \
--enable-mqtt-config \
--project=${PROJECT}

# Cloud Pub/Sub Topics
gcloud pubsub topics create ${EVENT_TOPIC} ${STATE_TOPIC} \
--project=${PROJECT}

# Generate ECDSA Keys for devices, e.g.: esp01, esp02
for DEVICE in "esp01" "esp02"
do
  openssl ecparam \
    -genkey \
    -name prime256v1 \
    -noout \
    -out ./keys/${DEVICE}.private.pem
  openssl ec \
    -in ./keys/${DEVICE}.private.pem \
    -pubout \
    -out ./keys/${DEVICE}.public.pem
done

# Create Cloud IoT Devices
for DEVICE in "esp01" "esp02"
do
  gcloud iot devices create ${DEVICE} \
  --project=${PROJECT} \
  --region=${REGION} \
  --registry=${REGISTRY} \
  --public-key=path=./keys/${DEVICE}.public.pem,type=es256-pem
done
I tweaked Google’s JWT sample code link in order to generate JWTs from the private keys:
for DEVICE in "esp01" "esp02"
do
  go run github.com/DazWilkin/JWT \
  --project=${PROJECT} \
  --private-key=../keys/${DEVICE}.private.pem > ../keys/${DEVICE}.jwt
done
The JWTs are (strings and) used as the password for a MQTT client; the username is unused and may be anything (e.g. unused)
NB The JWTs are configured with a relatively near expiry (I used 48 hours) and so will need to recreated
We also need the fingerprint (!) for Google’s CA root certificates (here: https://pki.google.com/roots.pem).
I was unable to use esphome mqtt-fingerprint for this and used instead:
FINGERPRINT=$(\
    openssl x509 \
      -in roots.pem \
      -noout \
      -fingerprint \
      -sha1 \
      -inform pem  \
    | cut -d'=' -f 2 \
    | sed 's|:||g' \
    | tr '[:upper:]' '[:lower:]') & echo ${FINGERPRINT}
d1eb23a46d17d68fd92564c2f1f1601764d8e349
With which we may now define the broker:
mqtt:
  broker: mqtt.googleapis.com
  ssl_fingerprints:
    - ${FINGERPRINT}
  username: unused
  password: $(cat ./keys/esp01.jwt)
  client_id: projects/${PROJECT}/locations/${REGION}/registries/${REGISTRY}/devices/${DEVICE}
  birth_message:
    topic: /devices/${DEVICE}/events
    payload: online
    qos: 0
    retain: True
Unfortunately, this produced errors:
.piolibdeps/esp01/ESPAsyncTCP-esphome_ID6757/src/ESPAsyncTCP.cpp: In member function 'err_t AsyncServer::_poll(tcp_pcb*)':
.piolibdeps/esp01/ESPAsyncTCP-esphome_ID6757/src/ESPAsyncTCP.cpp:1324:31: error: no matching function for call to 'AsyncClient::_recv(tcp_pcb*&, pbuf*&, int)'
         c->_recv(pcb, p->pb, 0);
                               ^
.piolibdeps/esp01/ESPAsyncTCP-esphome_ID6757/src/ESPAsyncTCP.cpp:1324:31: note: candidate is:
.piolibdeps/esp01/ESPAsyncTCP-esphome_ID6757/src/ESPAsyncTCP.cpp:565:6: note: void AsyncClient::_recv(std::shared_ptr<ACErrorTracker>&, tcp_pcb*, pbuf*, err_t)
 void AsyncClient::_recv(std::shared_ptr<ACErrorTracker>& errorTracker, tcp_pcb* pcb, pbuf* pb, err_t err) {
      ^
.piolibdeps/esp01/ESPAsyncTCP-esphome_ID6757/src/ESPAsyncTCP.cpp:565:6: note:   candidate expects 4 arguments, 3 provided
Compiling .pioenvs/esp01/lib8f0/ESP8266mDNS/ESP8266mDNS_Legacy.cpp.o
Compiling .pioenvs/esp01/lib8f0/ESP8266mDNS/LEAmDNS.cpp.o
Compiling .pioenvs/esp01/lib8f0/ESP8266mDNS/LEAmDNS_Control.cpp.o
And I was unable to resolve these:
If anyone has guidance, I’d appreciate the help!