Trendnet TEW-812DRU and DD-WRT
- 4 minutes read - 727 wordsThe FBI Portland published an interesting advisory with several, sensible recommendations including firewalling IoT devices from other devices on a home network. I decided to deploy a redundant Trendnet TEW-812DRU version 2.0 for this purpose.
Caveat Developer: Before I go further, I don’t recommend installing DD-WRT on a Trendnet TEW-812DRU unless you’re willing to brick the device irrecoverably.
I read the DD-WRT instructions several times (“peacock thread”,router database – do not use v3.0 beta builds!), thought I’d followed them and still (temporarily) bricked my router using the firmware downloaded from the DD-WRT router database. It is thanks to Justin’s help and his post that I was encouraged to try restoring my device to the Trendent firmware and then retring the DD-WRT installation with an older firmware version.
So, assuming you have a Trendnet TEW-812DRU that you’re willing to irrecoverably brick…
This DD-WRT version worked for me: https://download1.dd-wrt.com/dd-wrtv2/downloads/betas/2019/04-25-2019-r39654/trendnet-812DRUv2/
Daniele has a useful post describing monitoring an ASUS device running DD-WRT w/ Promethues (link). After getting DD-WRT running on the TEW-812DRU, I looked around and learned:
- DD-WRT runs BusyBox
- The TEW-812DRU has an ARMv7 Processor
- Various tools are employed by DD-WRT: dropbear, wland, dnsmasq, nas
- Using
sshdthe username continues to berooteven if changed in the GUI - The nas processes(es) show how the GUI Wifi configuration maps to
nasprocesses nvram(non-volatile RAM) holds configuration data e.g. whether sshd is enabled
Prometheus | Node Exporter
Daniele described using SNMP and a Lua script that generates (“exports”) Prometheus metrics. I was unable to find SNMP running on my device (neither in the GUI nor as a running process) and assume that this is an optional extra that’s included in builds for devices with more accessible RAM. My device did not have lua installed either.
I decided to try Node Exporter. The learning here and a tweak is that – IIUC – the ARM processor on the TEW-812DRU (or the build I’m using) does not support floating-point math. After compiling Node Exporter for GOARM=7 (per the output from /proc/cpuinfo), I received errors. I learned that ARMv5 contains a software implementation for floating-point math. Building Node Export with GOARM=5 works. I built Node Exporter on my workstation:
CGO_ENABLED=0 \
GOOS=linux \
GOARCH=arm GOARM=5 \
go build -a -tags netgo -ldflags '-w -extldflags "-static"' *.go
And then SCP’d it to the router:
scp -i ~/.ssh/my_private_key root@192.168.1.1
NB Node Exporter is not persisted across router reboots
And then, from the router:
ssh -i ~/.ssh/my_private_key root@192.168.1.1
And
./node_exporter \
--no-collector.infiniband \
--no-collector.mdadm \
--no-collector.meminfo \
--no-collector.netstat \
--no-collector.powersupplyclass \
--no-collector.schedstat \
--no-collector.softnet
NB I’m excluding various collectors with metrics that appear (!?) unavailable|inaccessible on the router
The exporter uses the default port (:9100) specified (implicitly in my case) by --web.listen-address=":9100"
Back on my workstation, I can then reference the DD-WRT device (and the Prometheus server itself) from prometheus.yml:
global:
  scrape_interval: 1m
  evaluation_interval: 1m

scrape_configs:
  # Self
  - job_name: "prometheus-server"
    static_configs:
      - targets:
          - "localhost:9090"

  # DD-WRT
  - job_name: "dd-wrt"
    scrape_interval: 1m
    static_configs:
      - targets:
          - "192.168.1.1:9100"
And then run the server:
docker run \
--interactive --tty --rm \
--publish=9090:9090 \
--volume=${PWD}/prometheus.yml:/etc/prometheus/prometheus.yml \
prom/prometheus@sha256:35c52c0c2b76433bbfc44a5a7abc294c2f032ed80250be02b441db5dd91b203a
Here showing the targets (responding correctly) on http://localhost:9090/targets:

I’ve 2 wireless devices (eth0 and eth1) and so can select only these using {device=~"eth0|eth1"}
NB The =~ for specify a regex and then eth0|eth1 which is equivalent to eth[0|1]
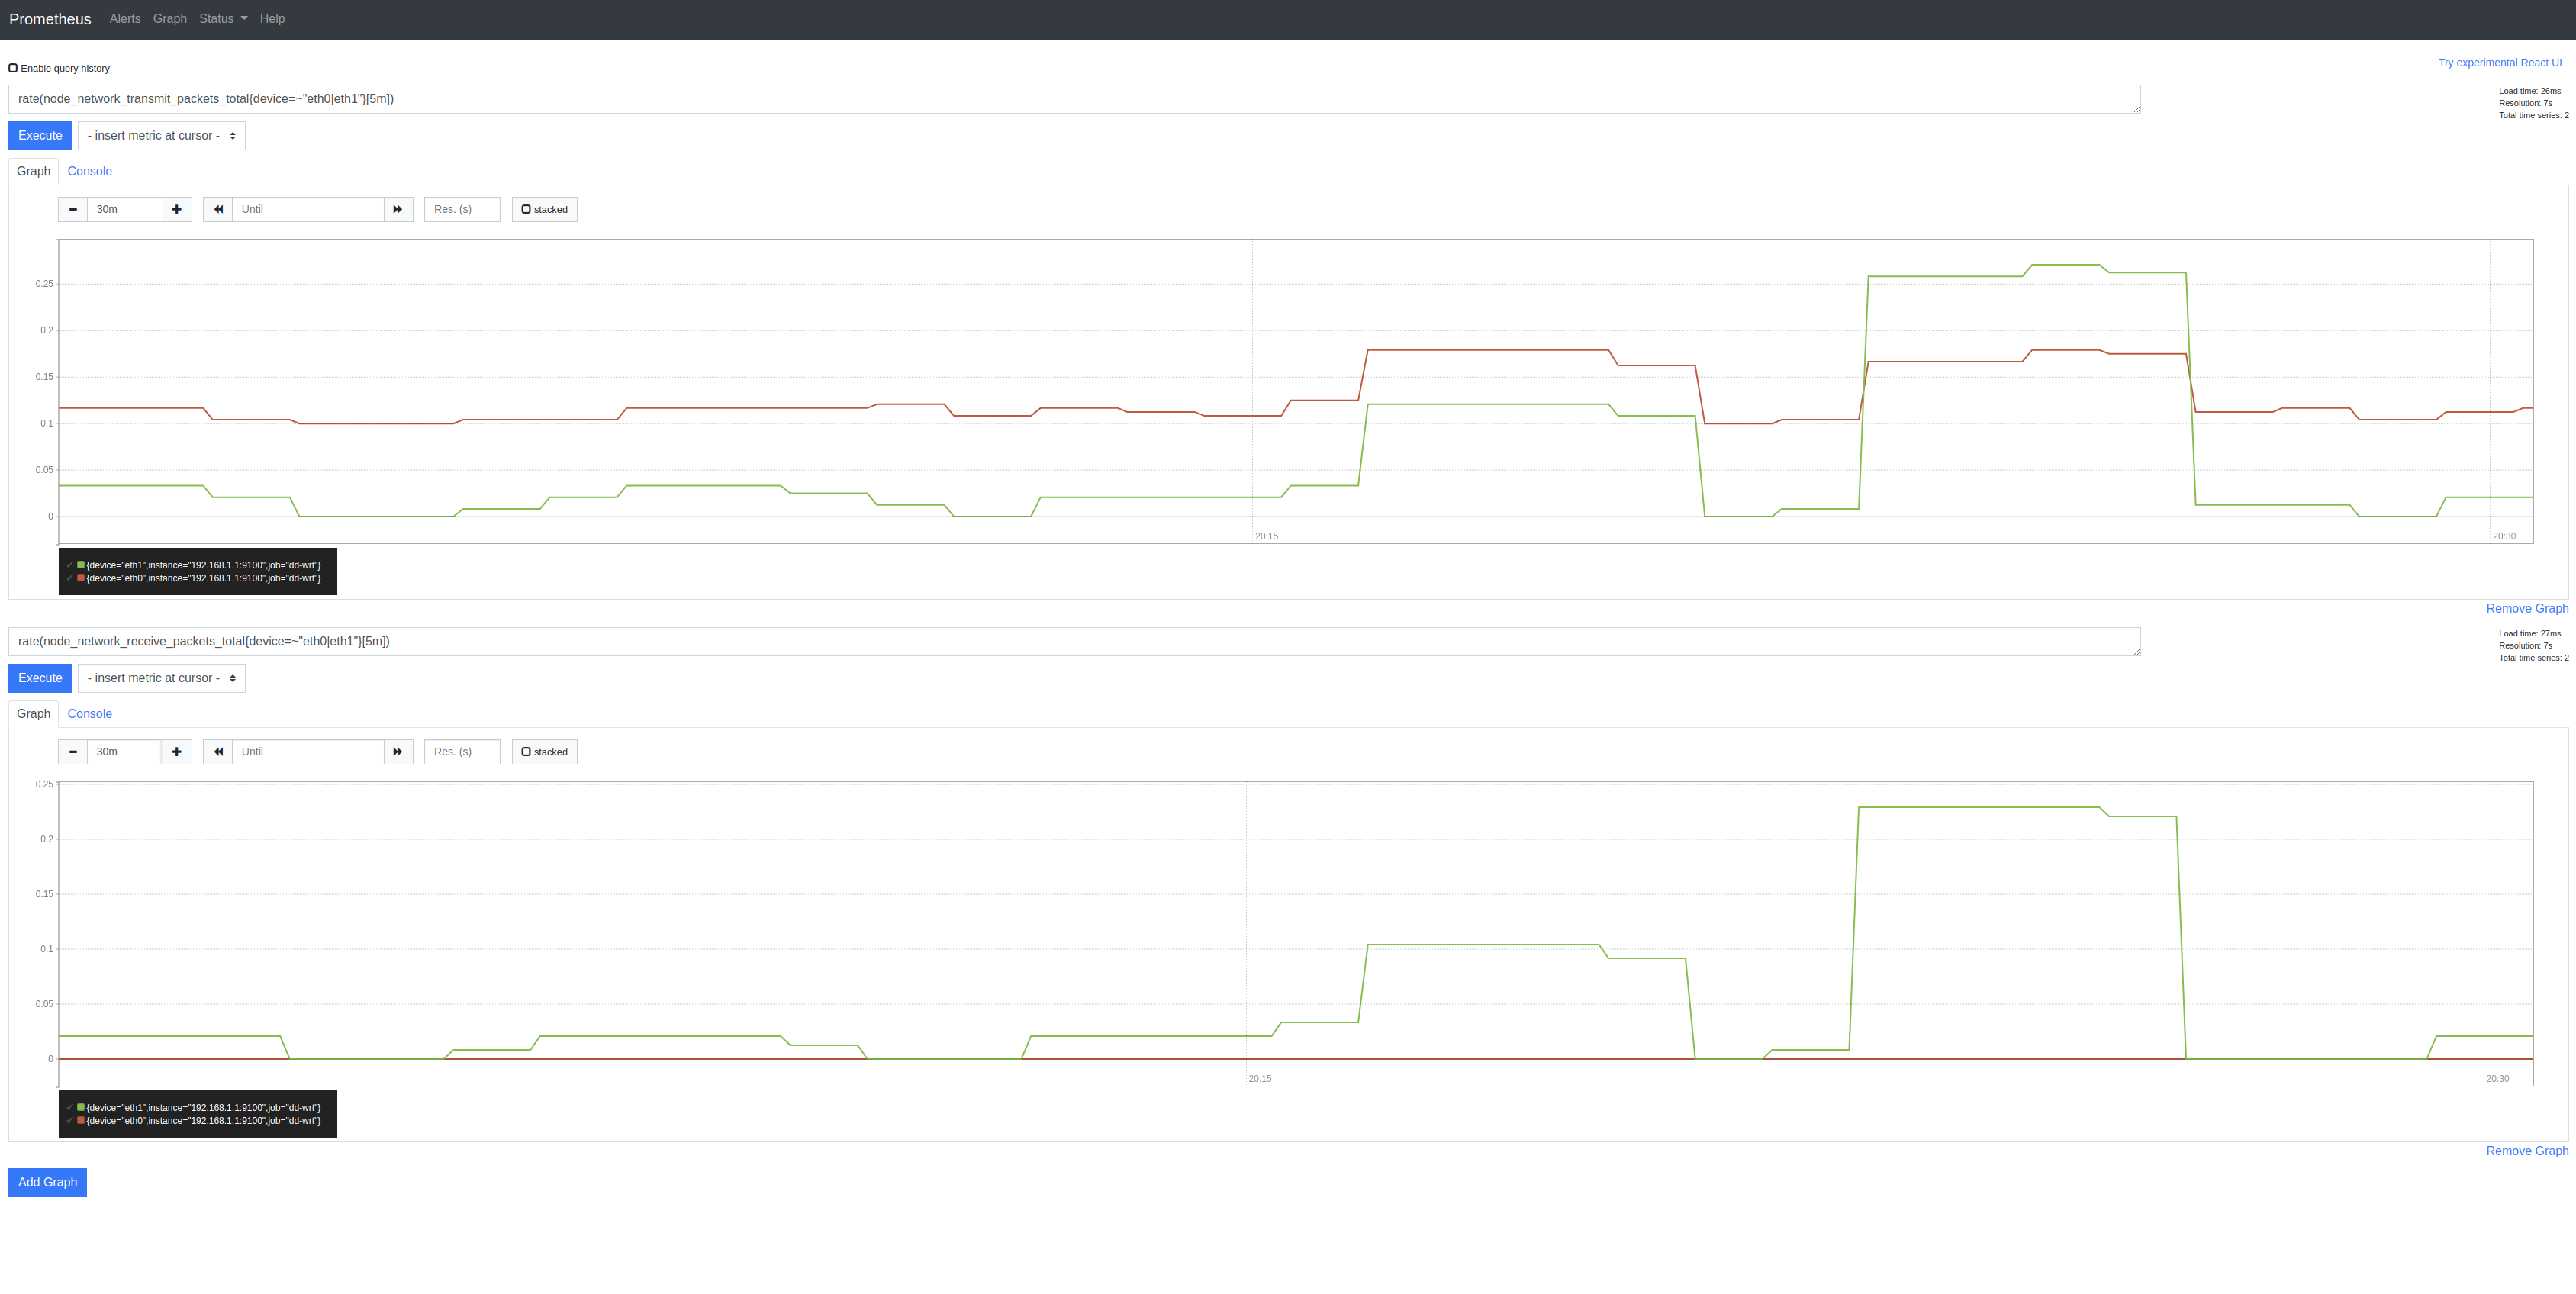
There are many metrics available but node_network_transmit_packets_total and node_network_receive_packets_total look useful:
Because these are both counters:
# HELP node_network_transmit_bytes_total Network device statistic transmit_bytes.
# TYPE node_network_transmit_bytes_total counter
Let’s use PromQL to convert them into (per-second!) rates over 5-minutes: rate(${METRIC}[5m])
i.e.
rate(node_network_transmit_packets_total{device=~"eth0|eth1"}[5m])
rate(node_network_receive_packets_total{device=~"eth0|eth1"}[5m])
Yields:

nvram
See: https://forum.dd-wrt.com/wiki/index.php/Hardware
Using Omega Onions, I was acquainted with uci and tried this on DD-WRT without success. The functional equivalent appears to be using nvram to read|write configuration data. After disabling traff, there’s a recommendation to delete data it may have captured too, using:
for i in `nvram show | grep traff- | cut -f1 -d=""`
do
  echo ${i}
  nvram unset ${i}
done
Noodling around, I found:
nvram show | grep snmp
block_snmp=1
I assume this means that SNMP is blocked
telnet_wanport=23
telnetd_enable=0
remote_mgt_telnet=0
limit_telnet=0
I’ve disabled telnetd (I’m using ssh – see below)
sshd_forwarding=0
sshd_port=22
sshd_passwd_auth=1
sshd_enable=1
sshd_rsa_host_key=-----BEGIN RSA PRIVATE KEY-----
sshd_wanport=22
sshd_authorized_keys=ssh-rsa [[REDACTED]]]]
I’ve enabled sshd on (default) port :22; sshd_wantport=22 is shown too but I’m (slightly) confident, this isn’t available remotely.
That’s all!